Russ Mould, investment director at AJ Bell, looks at four reasons why the precious metal – and gold miners - could offer further gains in 2018 and beyond and how retail investors can gain exposure to gold:
1. Inflation
“Gold is often seen as a hedge against inflation, or a store of value, and at the moment the reflation trade is dominating financial markets, fuelled by hopes for a synchronised acceleration in global economic activity and the Trump tax changes in particular. Although wage inflation and headline inflation figures generally remain subdued (with the exception of the UK), purchasing managers’ indices have begun to flag nascent price pressures and the manner in which stocks and commodities have outperformed Government bonds over the last six months or so suggest the inflation narrative is gathering pace.”
2. Interest rates
“Bears of gold will growl that the US Federal Reserve and Bank England have begun to raise interest rates and the European Central Bank has begun to taper its Quantitative Easing scheme, asserting that tighter monetary policy is not good for gold. Yet a study of gold’s performance relative to the Federal Reserve’s rate-hiking cycles shows that this is a total fallacy.
“During the eight cycles of falling Fed Funds rates gold has on average gained 3% between the first cut and the last.
“During the seven cycles of higher Fed funds rates the metal has on average gained 86% between the first increase and the last – and gold is already up by 23% since Janet Yellen sanctioned the first hike of this cycle back in December 2015.”
US interest rate cycle | Gold price ($ / oz) | |||||||
| From | To | Start | End | Change | Start | End | Change |
Lower | 11-Jan-71 | 09-Feb-71 | 4.50% | 3.50% | -1.00% | 37 | 39 | 3.9% |
Lower | 31-Jul-74 | 26-Nov-76 | 11.00% | 4.75% | -6.25% | 159 | 131 | -17.9% |
Lower | 07-Jul-81 | 14-Dec-82 | 19.00% | 8.50% | -10.50% | 407 | 448 | 10.1% |
Lower | 30-Aug-84 | 21-Aug-86 | 11.56% | 5.88% | -5.69% | 349 | 383 | 10.0% |
Lower | 06-Jun-89 | 04-Sep-92 | 9.81% | 3.00% | -6.81% | 365 | 343 | -6.1% |
Lower | 06-Jul-95 | 17-Nov-98 | 6.00% | 4.75% | -1.25% | 386 | 297 | -23.0% |
Lower | 03-Jan-01 | 25-Jun-03 | 6.50% | 1.00% | -5.50% | 268 | 344 | 28.6% |
Lower | 18-Sep-07 | 16-Dec-08 | 5.25% | 0.25% | -5.00% | 715 | 850 | 18.8% |
Average | 737 days |
|
| -5.25% |
|
| 3.0% | |
|
|
|
|
|
|
|
|
|
US interest rate cycle | Gold price ($ / oz) | |||||||
Higher | 15-Jul-71 | 25-Apr-74 | 3.50% | 11.00% | 7.50% | 40 | 175 | 332.4% |
|
|
|
|
|
|
|
|
|
Higher | 01-Aug-77 | 18-May-81 | 4.75% | 19.00% | 14.25% | 144 | 482 | 233.5% |
Higher | 31-Mar-83 | 09-Aug-84 | 8.50% | 11.56% | 3.06% | 418 | 346 | -17.3% |
Higher | 04-Dec-86 | 04-May-89 | 5.88% | 9.81% | 3.94% | 388 | 379 | -2.3% |
Higher | 04-Feb-94 | 01-Feb-95 | 3.00% | 6.00% | 3.00% | 385 | 376 | -2.2% |
Higher | 30-Jun-99 | 16-May-00 | 4.75% | 6.50% | 1.75% | 263 | 273 | 3.7% |
Higher | 30-Jun-04 | 29-Jun-06 | 1.00% | 5.25% | 4.25% | 396 | 613 | 54.8% |
Average | 742 days |
|
| 5.39% |
|
| 86.1% | |
|
|
|
|
|
|
|
|
|
Latest US interest rate cycle | Gold price ($ / oz) | |||||||
Higher | 16-Dec-15 | ? | 0.25% | 0.50% | 0.25% | 1,070 | 1,316 | 23.0% |
Source: Thomson Reuters Datastream
3. Bearish sentiment
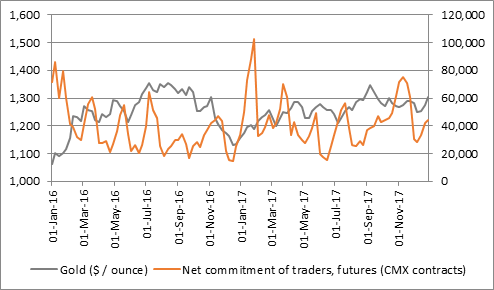
“Gold may be trading at a three-month high, in dollar terms but it no higher now than it was in summer 2013, in marked contrast to stocks, and the metal stands well below the September 2011 peak of $1,900 an ounce. In addition, the market currently seems to be positioned relatively bearishly on the metal, judging by commitment of traders’ positions, as measured in futures contracts data from the US Commodity Futures Trading Commission (CFTC).
“Net long futures exposure sank to less than 30,000 contracts in mid-December, and resurgence to 44,122 by the end of 2017 helped to nudge gold higher.”
Source: Thomson Reuters Datastream
4. Tempting valuations of gold miners
“Although gold rose 13% in dollar terms in 2017, gold mining shares remained in the doldrums. The NYSE Arca Gold Bugs Index, known as the HUI, is made up of 50 global gold mining stocks and it advanced by just 5% last year. That underperformance of the underlying metal left the HUI-to-gold ratio at near 20-year lows, to suggest that if gold does keep rising then the miners may have some catching up to do.”
How retail investors can play gold
“Investors who feel that gold may offer some useful diversification in a balanced portfolio still have to address the question of how best to access the asset.
“This can be done directly, via individual mining stocks or baskets of mining companies, via actively or passively managed funds, although each comes with a different risk-reward profile.
Gold tracker
“The first option is to pick an exchange-traded commodity (ETC), or gold tracker fund, as investors may not wish to go to the trouble of storing and insuring their own gold bars or coins.
“It is possible to track the gold price in dollars or sterling and do so via the physical metal or futures prices, according to your preference. Options to research include ETFS Physical Gold (EPIC code PHAU), ETFS Gold ETC (EPIC code BULL) and db Physical Gold GBP Hedged ETC (EPIC code XGLS).
Passively run fund of gold miners
“For those who believe gold miners are cheap relative to gold – and who are prepared to take on the additional risk posed by miners’ operational gearing to the metal’s price – there is the option of a tracker fund which is designed to deliver the return generated by a basket of miners, minus the instrument’s own running costs. ETFX DAXglobal Gold Mining, iShares Gold Producers, VanEck Gold Miners and VanEck Vectors Junior Gold Miners are all quoted on the London Stock Exchange and can be bought and sold in dollars or pounds. They come with annual total expense ratios of between 0.51% and 0.65%.
Actively run fund of gold miners
“There is a select number of active funds where a professional money manager will seek to pick out the best-performing gold mining stocks and avoid any duds, to maximise returns from the industry. Investors will pay a fee for accessing this expertise, ranging from 0.72% at Smith & Williamson Global Gold and Resources to 3.41% at SF Peterhouse Smaller Companies Gold Fund. BlackRock Gold and General may be the best-known fund in this field, although Investec Global Gold and Ruffer Gold Fund are other options to research.
“There are also a number of London Stock Exchange-quoted investment trusts which dedicate themselves to gold (and also silver and platinum and palladium) miners. These include Golden Prospect Precious Metals, which comes at an interesting 20% discount to net asset value but with a 3.16% ongoing charge figure. BlackRock Commodities Income and BlackRock World Mining offer some exposure to gold miners.
“Also note that a fund such as Troy Trojan has exposure to gold as part of its multi-asset strategy that is designed to provide capital protection as much as it does capital appreciation.
Individual gold stocks
“Intrepid investors who do not wish to pay fees for funds can pick their own stocks and although this route could bring the highest returns if gold does well, it comes with the highest risks if gold retreats. There is also the danger that the mining stock goes down even if gold rises owing to company specific issues.
“There is one dedicated gold miner in the FSTE 100, Randgold Resources, while Fresnillo produces gold as an offshoot at its silver mines. Centamin is a member of the FTSE 250.
“The world’s biggest gold miners by stock market valuation are however listed in the USA. They are Barrick Gold, Newmont Mining and Franco-Nevada, although next on the list is Australia’s Newcrest Mining.”
“Anyone researching gold diggers must run through a rigorous check list to ensure that their selected miner is capable of benefiting if gold prices rise and weathering the storm if gold prices fall back again. Topics to investigate include
Whether a gold stock is already producing or merely in the exploration phase.
If it is in the exploration phase, you need to check where its gold resources are inferred (the lowest level of confidence), indicated or measured.
If it is in the production phase, the size of its resource and the production profile of existing mines
Where the company operates, and the risk (or otherwise) of difficulties with local governments over mining rights and taxes, as well as the susceptibility of individual mines to problems posed by difficult conditions, such as extreme weather
The company’s all-in sustaining cost (AISC) of producing an ounce of gold, as this will reveal how profitable (or otherwise) the firm will be relative to the prevailing metal price. Some miners just publish the cash cost figure but this may not include third-party smelting, refining, transport costs, local taxes and office running costs so it may not give the full picture
The experience and skill-sets of the management team and executive board
The miner’s balance sheet and how much cash or debt it has. The more of the former and the less of the latter the better, especially if gold prices drop.
