“Anyone who shares fund management legend Sir John Templeton’s view that ‘Bull markets are founded on pessimism, grow on scepticism, mature on optimism and die on euphoria’ will be happier with the latest bout of market volatility than most, in the view that some value opportunities could be emerging,” says Russ Mould, AJ Bell Investment Director.
“Applying this test can potentially help investors spot where value and future upside opportunities can be found – just as importantly – avoid areas which are so popular they could be overvalued and capable of doing damage to portfolios.
“At the start of 2018, the euphoria surrounding cryptocurrencies was all-pervasive, only for Bitcoin to promptly lose 75% of its value.
“By contrast, defensive equity sectors were widely viewed with scepticism 12 months ago year, amid widespread optimism regarding what was termed as a synchronised global recovery. But, using the S&P Global 1200 as a benchmark, Healthcare and Utilities turned out to be the best two performing super-sectors (out of 11) while Financials and Materials (miners), both cyclical areas that had been forecast to do well, did worst.
“Very few major asset classes beat cash or generated a positive total return in sterling terms in 2018 – German bunds and gold were rare exceptions and that hardly smacks of widespread optimism.
“Whilst it takes nerve and patience to go against the crowd, that is often where the best long-term returns are to be had, so perhaps the best news so far for investors in 2019 is that a lot of the euphoria of early 2018 has faded away to be replaced by nervousness, even gloom.
“The hard part is how to gauge where sentiment is washed out and there may be value to be had or where exuberance still prevails and danger may lurk. There is one quick version for stocks – which is to look at the VIX indices – while the best test of all is to analyse valuations carefully, on a case-by-case basis, looking at assets relative to their own history, the alternatives on offer and their projected future profit and cash flow streams.
The VIX (‘fear’) indices
“For equities, one short cut can be to track the VIX, or ‘fear,’ index which measures expected future price volatility.
“In the UK, the VIX has been running since 2000. The long-term average reading is 19.1 with a low of 6.2 in March 2017 (eight years into a bull run) and a high of 75.5 in October 2008, following the collapse of Lehman Brothers. The coincidence of the low with times of great optimism and the high with times of great pessimism suggests it can be a useful contrarian indicator.
“At the moment, the FTSE VIX reads 19.3, a smidgeon above its long-term average.
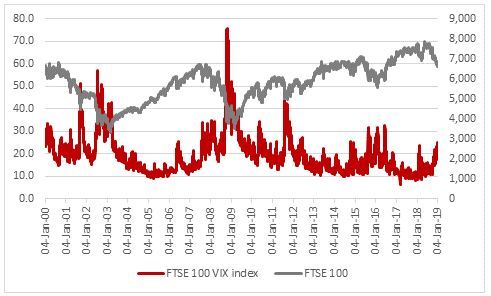
Source: Refinitiv data
“The VIX has been running in the USA since 1990, with an average reading of 19.3, a low of 8.9 (in November 2017 as the current bull market was on the march) and a high of 80.9 (in November 2008 as the Great Financial Crisis reached its height).
Again it is clear how times of great confidence (and low VIX readings) and times of great fear (and high VIX readings) gave a contrarian indicator as to when the market waters were safe and when they were not. Piling in during times of confidence has tended to prove painful and bravely stepping in when everyone else was panicking has been the better option, over the long term.
“The VIX reached 36.1 on Christmas Eve to suggest panic was setting in and US stocks were potentially oversold but it has since recovered to 21.4 as the S&P 500 has bounced. This does not smack of a long-term market bottom even if the recent recovery will have been welcomed by many investors.
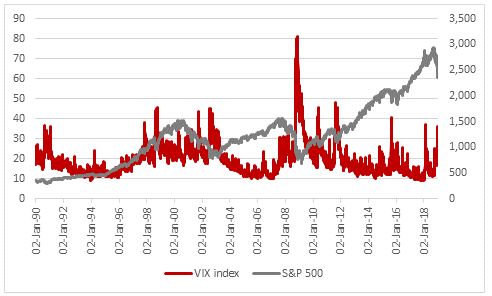
Source: Refinitiv data
Valuation
“Valuation is even more subjective and every bit as much of an art as it is a science. The most suitable techniques will depend upon the nature of the asset class or industry involved but multiples of earnings or cashflow or book value, or dividend yield, as well as long-term analysis via a discounted cashflow (DCF) model, can all be useful.
“Admittedly, there is no ‘right’ answer.
“Bulls of US stocks will argue that the S&P 500 index looks cheap on 14.3 times forward earnings for 2019 relative to its history.
“Bears will argue that lowly multiple is based on a forecast of yet another record high in US corporate profits and a 9% increase on 2018’s all-time high, despite gathering worries over a recession and increases in wage bills, interest costs and the dollar. Sceptics will therefore assert that it is better to look at US stocks on the basis of a 10-year rolling, historic earnings figure to take out some of the guesswork involved in profit forecasts.
“This is exactly what Professor Robert Shiller’s cyclically-adjusted price earnings (CAPE) ratio does, on an inflation-adjusted basis, and the results here offer less encouragement to bulls.
“Even after the second-half slide of 2018, US stocks still trade on a CAPE multiple of 29 times. The S&P 500 has reached a CAPE rating of around 30 times on two prior occasions, in 1929 and 1998-2000, and both of those episodes ultimately ended very badly.
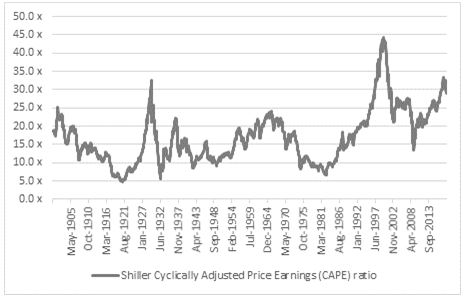
Source: http://www.econ.yale.edu/~shiller/data.htm
“Even though euphoria is a lot harder to find than it was a year ago this still suggests that US stocks – and tech stocks and the FAANGS in particular – remain popular.
“By contrast, emerging markets – a consensus favourite in January 2018 – are out in the cold after the summer rout. The loss of faith in Bitcoin is now tangible. Financials stocks are unloved after a horrid year and fat yields and low multiples of book value mean banks may pop up on ‘value’ screens – even if ‘value’ remains intriguingly out of favour.
“But if investors are really looking for an area where pessimism may mean value is available, look no further than the UK, wracked as it is by the Brexit debate – although admittedly you could have said the same at this time last year, to no great effect. It will be interesting to see if the FTSE 100 confounds its doubters in 2019 and beyond whether a deal is struck with the EU or not.”
One possible current interpretation of Sir John Templeton’s four market phases
|
Pessimism |
|
Scepticism |
|
UK equities and sterling |
|
Emerging market equities and bonds |
|
Oil and mining stocks |
|
Precious metals (and miners) |
|
Real estate stocks and brick retailers |
|
Banks and financial stocks |
|
Cryptocurrencies |
|
Japanese equities |
|
European equities |
|
US Government Bonds |
|
Value investing |
|
Income investing |
|
|
|
|
|
Euphoria |
|
Optimism |
|
Index proliferation |
|
FANG stocks |
|
Residential property |
|
The dollar |
|
|
|
US equities |
|
|
|
Healthcare stocks |
|
|
|
Growth investing |
|
|
|
Momentum investing |
