Ahead of next week’s policy decisions on interest rates from the US Federal Reserve (20 Mar) and Bank of England (21 Mar), Russ Mould, investment director at AJ Bell looks at central bank policy and how this might impact markets:
“What a difference three months makes. The European Central Bank is planning its third dollop of cheap cash for banks to lend out and the markets are now pricing in a chance of interest rate cuts from the US Federal Reserve, not increases, while the Bank of England stands by, waiting to see what Brexit may or may not bring.”
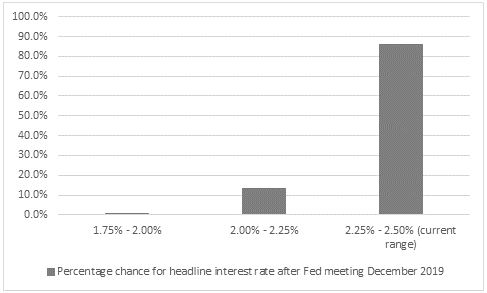
Source: CME Fedwatch
“This is a huge change from December when the European Central Bank stopped adding to its Quantitative Easing (QE) scheme, the US Federal Reserve was talking about two to three interest rate hikes.
“All of this raises the stakes for the coming week’s policy decisions from the US Federal Reserve (20 Mar) and Bank of England (21 Mar) even if no change is expected on either count.
“It also may help to explain why stock markets are sagging at the prospect of more central bank largesse, rather than whooping for joy and if investors are right to approach the prospect of Fed rate cuts with concern, does this mean the end of the so-called ‘Fed put?’
“Faith in the US central’s banks willingness and ability to support stock markets dates back to when then-chair Alan Greenspan waded in with a pair of quick-fire interest rate cuts and a $3.6 billion bail-out plan in the wake of Russian debt default and the collapse Long-Term Capital Management hedge fund in 1998. That set the scene for another leg-up in the 1990s US equity bull run and – in the eyes of some – stoked the technology, media and telecoms bubble that finally burst in 2000.
“The mantra among equity investors therefore became ‘Don’t Fight the Fed,’ but the historic performance data suggest that buying stocks on the first rate cut is not the guaranteed source of profits that this slogan would have you believe.
• The FTSE All-Share and first Bank of England rate cuts
|
First rate cut |
First rate cut |
FTSE All-Share performance after first rate cut |
|||
|
|
|
3 months |
6 Months |
1 Year |
2 years |
|
Jun-1965 |
7.00% |
(3.5%) |
6.1% |
12.1% |
3.9% |
|
Mar-1968 |
8.00% |
19.1% |
30.7% |
26.4% |
10.5% |
|
Jan-1974 |
13.00% |
(16.6%) |
(30.3%) |
(57.3%) |
10.5% |
|
Nov-1976 |
15.00% |
25.4% |
46.8% |
64.1% |
64.1% |
|
Jul-1980 |
17.00% |
6.7% |
7.2% |
17.9% |
16.6% |
|
Mar-1985 |
13.88% |
(1.9%) |
0.3% |
30.2% |
59.9% |
|
Oct-1990 |
14.88% |
(4.5%) |
15.8% |
18.5% |
13.3% |
|
Dec-1995 |
6.63% |
1.4% |
5.7% |
9.0% |
33.0% |
|
Oct-1998 |
7.50% |
27.8% |
35.5% |
33.0% |
40.8% |
|
Feb-2001 |
6.00% |
(5.1%) |
(11.7%) |
(17.3%) |
(42.0%) |
|
Dec-2007 |
5.75% |
(10.1%) |
(8.6%) |
(38.8%) |
(19.8%) |
|
AVERAGE |
|
3.5% |
8.9% |
8.9% |
17.3% |
Source: Refinitiv data, Bank of England
“For investors with exposure to the UK, the good news is that over the 11 rate-cut cycles since the inception of the FTSE All-Share in the early 1960s, the index has gained after the first decrease in borrowing costs on a three-, six-, 12- and 24-month view.
“Yet the hit rate over the first three months is patchy (five gains, six losses) and the last two rate-cutting cycles, that began in 2001 and 2007, started disastrously for buyers, with losses over a two-year period as recessions bit hard, earnings disappointed and equity valuations proved unsustainable.
• The S&P 500 and US Federal Reserve rate cuts
“The data over eight rate-cutting cycles since 1970 from the USA makes for grimmer reading.
“Buyers of US stocks after the first rate cut from the Fed have lost money on average over the past eight rate-cutting cycles on a three-, six- and 12-month view, with the last two being particularly painful, when ‘fighting the Fed’ was actually the right thing to do.
|
First rate cut |
First rate cut |
S&P 500 performance after first rate cut |
|||
|
Date |
From |
3 months |
6 Months |
1 Year |
2 years |
|
Jan-1971 |
4.50% |
10.1% |
8.6% |
11.7% |
29.7% |
|
Jul-1974 |
11.00% |
(23.5%) |
(20.3%) |
(8.1%) |
(0.1%) |
|
Jul-1981 |
19.00% |
(5.4%) |
(7.3%) |
(16.4%) |
30.7% |
|
Aug-1984 |
11.56% |
(1.8%) |
8.8% |
13.2% |
51.8% |
|
Jun-1989 |
9.81% |
7.7% |
7.5% |
12.6% |
18.3% |
|
Jul-1995 |
6.00% |
5.1% |
11.3% |
18.7% |
65.5% |
|
Jan-2001 |
6.50% |
(17.9%) |
(8.4%) |
(13.5%) |
(32.6%) |
|
Sep-2007 |
5.25% |
(4.3%) |
(12.4%) |
(20.6%) |
(29.7%) |
|
AVERAGE |
|
(3.7%) |
(1.5%) |
(0.3%) |
16.7% |
Source: Refinitiv data, US Federal Reserve
“All of this may be jumping the gun, since the Federal Reserve is still shrinking its balance sheet and markets may be kidding themselves by pricing in any chance of a cut from the US central bank this year.
But the words of the architect of QE in the USA, former Fed chair Ben S. Bernanke, may now be coming back to haunt central bankers (and investors) around the world. Back in 2009, Bernanke explained QE to Congress thus:
‘Clearly this is a temporary measure which is intended to provide support for the economy in this extraordinary period of crisis and when the economy is back on the road to recovery, we will no longer need to have these measures.’
“Perhaps stock market investors are now taking him at his word and thinking that the economy is still not in the best of health after all, despite ten years of extraordinarily loose policy.
“And if that did not work, what remedies will central banks try next?”
