“America’s S&P 500 index is trying to record its eighth straight monthly gain - its best run without a loss since its 10-month romp between April 2017 and January 2018 – and the FAANGM sextet continues to a lot of the legwork,” says AJ Bell Investment Director Russ Mould. “For all of the niggling doubts about the lack of follow-through and support from the
the small-cap Russell 2000 index and the Dow Jones Transportation index, neither of which are setting fresh highs of their own, it may take a loss of confidence in – and lack of fresh flows toward – Facebook, Apple, Amazon, Netflix, Google’s parent Alphabet and Microsoft for that US market to crack. In this context, though, the first dip in US margin debt since February 2020 catches the eye.
Margin debt is the amount of money an investor can borrows from their broker via a margin account to buy shares (or even short sell them). This looks smart and gears us returns when markets are rising (as the investor or trader can get more exposure) but looks less clever when markets are falling. Indeed, falling asset prices can force so-called margin calls where the investor or trader must start repaying the loan – and sometimes they must sell other positions to fund that repayment, creating a negative feedback loop in markets.
“The last time margin debt dipped was March 2020, just as the pandemic began to make its presence felt not just in Asia but Europe and America as well.
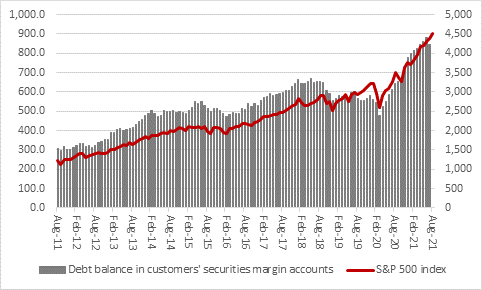
Source: FINRA, Refinitiv data
“This first dip in margin debt must be watched, especially in light of Securities and Exchange Commission (SEC) queries about regulatory filings from the investment platform Robinhood and questions about its business model and whether payment for order flow is appropriate. It remains to be seen whether this dampens some of the liquidity flow which has done so much to elevate certain sections of the US stock market, but it may be no coincidence that what looked like some of the frothier areas have started to flag.
“Whether trading losses are sparking a slight decrease in risk appetite or whether a more cautionary approach (perhaps considering Federal Reserve reverse repo operations and talk of tapering) is lessening demand for initial public offerings (IPOs), Special Purpose Acquisition Companies (SPACs) and growth and tech stocks is hard to divine.
“But what is clear is that some of the hottest areas of the US market are showing some sign of cooling.
“New market entrants have started to lose their appeal, judging by the performance of the Renaissance IPO ETF and Renaissance International IPO ETF. The former is currently tracking the performance of 72 American new floats, the latter 62 global ones. The International vehicle may be suffering owing to its 44% weighting toward China and the US-oriented version is at least trying to claw back lost ground.
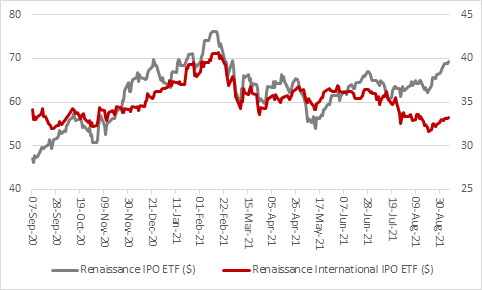
Source: Refinitiv data
“Enthusiasm for cash shells set up to acquire what they fancy is also waning. The Next Gen Defiance SPAC Derived ETF, which tracks a basket of nearly 300 Special Purpose Acquisition Companies (SPACs is down by more than a third from its high. This is perhaps less of a surprise when you consider the data from the website www.SPACinsider.com, which shows how 351 SPACs are looking for a target even though 404 have already floated this year. In the end, supply may be outstripping demand.
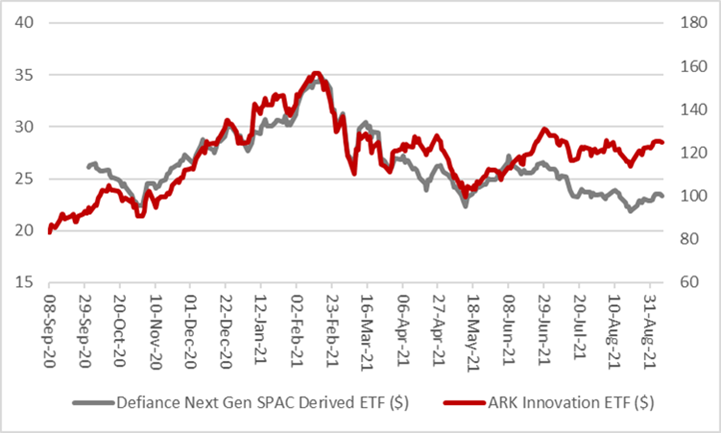
Source: Refinitiv data
“Even Cathie Wood’s ARK Innovation ETF, the darling of growth- and momentum-seekers, has found the going to be a bit tougher of late. The $22 billion behemoth, whose biggest holdings are Tesla, Teladoc and Roku trades a fifth below its high (although supporters will counter that it is up by a quarter from its spring lows).
“None of this is conclusive and the attempted rallies in the ARK Innovation ETF and the Renaissance IPO ETF could yet signal the next upward surge in US equities. Investors would do well to keep an eye on them, and trends on the monthly margin debt figure from FINRA as useful indicators of market sentiment.
“Yet for the US market to really roll-over its leaders must have to falter and there is little sign yet of investors falling out of love with Facebook, Apple, Amazon, Netflix, Google’s parent Alphabet and Microsoft.
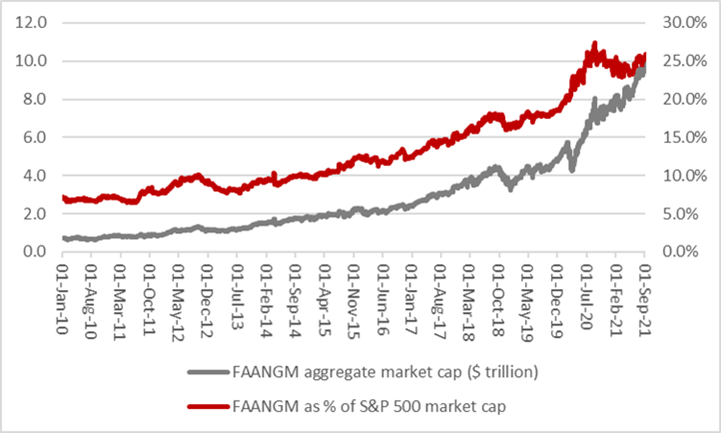
Source: Refinitiv data
“Their aggregate $9.8 trillion market cap is the equivalent of more than three times that of the FTSE 100 and they represent a quarter of the S&P 500’s value between them.
“If the S&P is to stumble, then this sextet will surely have to do so too, even if the other 494 members of the benchmark index can point to a 35% (or $7.5 trillion) gain of their own in the last 12 months. Overall, the six FAANGM names on their own have provided one quarter of the S&P 500’s total value uplift over the last 12 months.”
Spotting what could cause a loss of interest in the FAANGMs is the hard bit, such is their dominance, and in the absence of regulation it may take a jump in interest rates or a wider, unexpected shock to prompt investors to sell such core holdings, just as happened with the oil price shock and inflation which did for the previously unassailable ‘Nifty Fifty’ in 1973-74.”
