The ten previous, post-war bull runs in the S&P 500 lasted for an average of 1,736 days and offered an average capital gain of 283%. The 3,399 upcycle than began in March 2009 has so far produced a gain of 401%.
Post-war bull runs in the S&P 500 index | |||||
Start | Finish | Duration (days) | Start | Finish | Gain |
03-Jan-50 | 03-Aug-56 | 2,404 | 17 | 50 | 294.1% |
22-Oct-57 | 13-Dec-61 | 1,513 | 39 | 73 | 187.2% |
26-Jun-62 | 14-Feb-66 | 1,329 | 52 | 94 | 180.8% |
07-Oct-66 | 29-Nov-68 | 784 | 73 | 108 | 147.9% |
26-May-70 | 11-Jan-73 | 961 | 69 | 120 | 173.9% |
04-Oct-74 | 28-Nov-80 | 2,247 | 62 | 141 | 227.4% |
12-Aug-82 | 25-Aug-87 | 1,839 | 102 | 337 | 330.4% |
19-Oct-87 | 16-Jul-90 | 1,001 | 225 | 369 | 164.0% |
11-Oct-90 | 24-Mar-00 | 3,452 | 295 | 1,527 | 517.6% |
09-Oct-02 | 09-Oct-07 | 1,826 | 777 | 1,565 | 201.4% |
|
|
|
|
|
|
Average |
| 1,736 |
|
| 282.6% |
09-Mar-09 | current | 3,399 | 677 | 2,717 | 401.3% |
Source: Thomson Reuters Datastream
The UK’s latest upswing is looking equally long in the tooth. The nine previous bull runs witnessed since the establishment of the FTSE All-Share in the early 1960s lasted for an average of 1,200 days and offered an average capital gain of 143%. The upcycle than began in March 2009 has already lasted for 3,403 days and offered a gain of 133%.
This was only exceeded in length by the 3,863 day bull-run of November 1987 to June 1998.
Post-war bull runs in the FTSE All-Share index | |||||
Start | Finish | Duration (days) | Start | Finish | Gain |
27-May-70 | 15-Aug-72 | 811 | 114 | 226 | 98.2% |
06-Jan-75 | 06-Jun-75 | 151 | 62 | 154 | 148.4% |
08-Aug-75 | 03-May-76 | 269 | 122 | 172 | 41.0% |
20-Oct-76 | 07-May-79 | 929 | 116 | 284 | 144.8% |
15-Nov-79 | 17-Aug-81 | 641 | 220 | 339 | 54.1% |
28-Sep-81 | 16-Jul-87 | 2,117 | 266 | 1,239 | 365.8% |
10-Nov-87 | 08-Jun-98 | 3,863 | 785 | 2,868 | 265.4% |
08-Oct-98 | 31-Dec-99 | 449 | 2,178 | 3,242 | 48.9% |
12-Mar-03 | 25-Jun-07 | 1,566 | 1,593 | 3,479 | 118.4% |
|
|
|
|
|
|
Average |
| 1,200 |
|
| 142.8% |
03-Mar-09 | current | 3,403 | 1,789 | 4,165 | 132.8% |
Source: Thomson Reuters Datastream
Russ Mould, investment director at AJ Bell, comments:
“After a nine-year bull run in stocks (and for that matter most asset classes) – investors must again ask themselves whether this is a warning of more difficult times to come or simply part of the natural rough and tumble of the financial markets.
“Investing is often at its most dangerous when making money looks easiest and portfolio builders should remain vigilant, checking out whether the latest minor bout of volatility is more like 1994 (a blip), 1997-98 (a mid-cycle fall that was followed by two more years of bounty) or 2000 and 2007 (a big warning sign that the party is about to end).
The bull case
1. Buoyed by President Trump’s tax cuts, America’s economy is going gangbusters, with the Atlanta Fed GDP Now survey forecasting an annualised growth rate of 4.7% for Q2 2018. Since the US is the world’s biggest economy, all boats may rise with the tide, supporting the current narrative of a globally synchronised recovery.
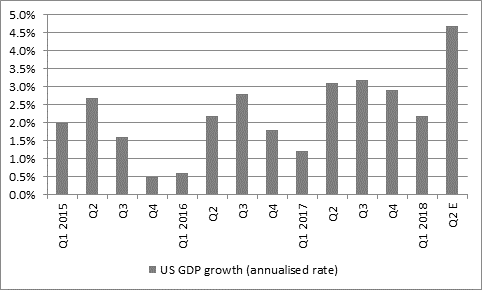
Source: FRED –St. Louis Federal Reserve, Atlanta Fed GDPNow estimate for Q2 2018
2. Inflation remains tame, undershooting central banks’ 2% target in Japan and Europe and exceeding it only marginally in the USA and UK
3. This means interest rates are rising only slowly in the USA, at a truly glacial pace in the UK, perhaps from September 2019 in Europe and not at all in Japan. Rotten returns on cash and low bond yields may therefore continue to force money into stocks.
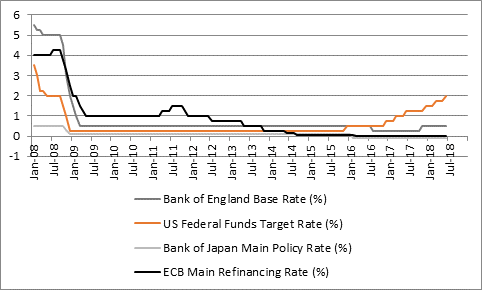
Source: Thomson Reuters Datastream
4. Global merger and acquisition activity keeps bubbling along, to suggest that there is still some value in global markets, while these deals return cash to investors which they can then put back into the markets
5. Global share buyback activity is also running at or near record pace, again returning cash to investors which they can then plough back into other shares
“Pretty much all of these points would have applied in 2000 and 2007, however, when a storm suddenly emerged from seemingly cloudless skies, leading in each case to a crunching equity bear market that erased around half of the gains made during the upcycle on both sides of the Atlantic.
“As such, investors need to be aware of the counter arguments to the bull case, which suggest that care is needed as share prices may find it harder to progress from here, or are even at risk of a fall.
The bear case
1. The MSCI World had made a capital loss of 0.8% to date in 2018, as of the close on Monday, despite all of the good news that has been on offer. The index has paddled sideways once the initial euphoria surrounding the Trump tax cuts began to wear off.
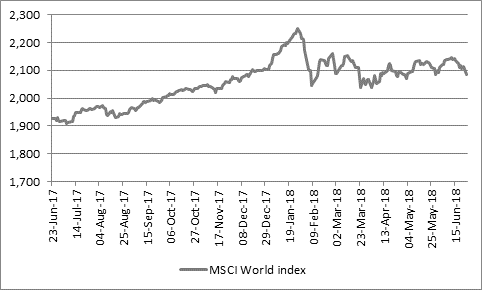
Source: Thomson Reuters Datastream
At least in sterling, total return terms the MSCI World has generated a return of 2.5%, although a lot of that comes from fresh falls in the pound. Note how Asia and Western Europe have struggled and Latin America in particular has taken a clobbering.
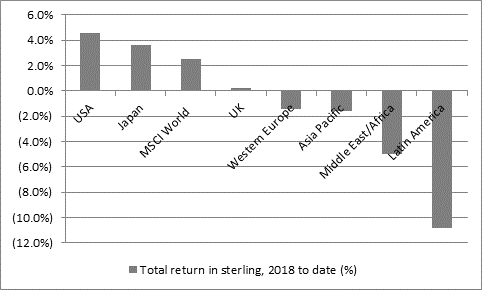
Source: Thomson Reuters Datastream. To the close on Monday 18 June 2018
The USA is doing best but a lot of that is down to strength in the dollar.
This suggests that a lot of good news could already be in the price and in the USA it is easy to argue that valuations are rich by historic standards, especially if you look at metrics like market cap to GDP or Professor Robert Shiller’s cyclically adjusted price/earnings ratio, which we can see here. On this metric, US stocks have only been this or more expensive in 1929, 2000 and 2007 – and disaster followed each time
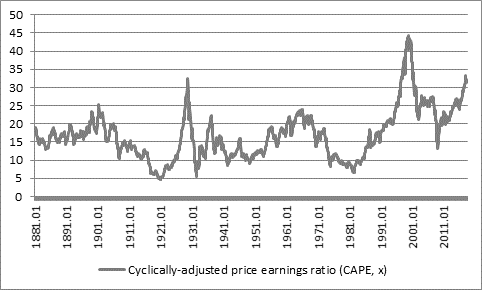
Source: http://www.econ.yale.edu/~shiller/data.htm
2. US interest rates are rising and perhaps more importantly the Federal Reserve is withdrawing Quantitative Easing and the European Central Bank is about to stop adding to QE. Share prices may therefore have less cheap money upon which to feed.
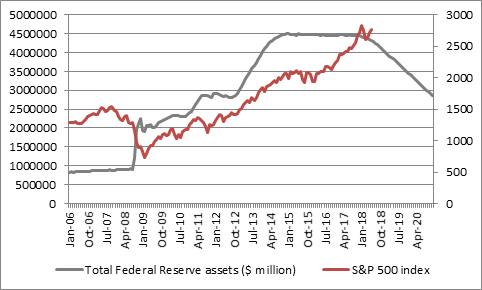
Source: FRED – St. Louis Federal Reserve database, Thomson Reuters Datastream. Future shrinkage of Federal Reserve assets based upon guidance given by chair Janet Yellen in June 2016.
3. Markets are doing their best to ignore geopolitical concerns such as Brexit in the UK, the rise of anti-EU parties in Italy, rising global indebtedness, a rising dollar, a strong oil price and the prospect of trade wars as the US, EU and China exchange tit-for-tat tariffs.
4. Record merger and acquisition and buyback activity are all well and good but they tend to occur near the top of stock market cycles, when animal spirits are running, not near the bottom.