“On the same day as the Senate agreed to increase the amount the US Government may borrow in total, the Federal Reserve released its latest G.19 data on consumer borrowing – and the numbers were not pretty.
“Total consumer debt rose by 3.1% to $18.4 trillion, as mortgage, credit card, auto and student loans all rose.
“Throw in rising corporate borrowings and America’s total debt pile (excluding pensions and Medicare liabilities) comes to around $60 trillion – and the really bad news is that figure has grown $7.6 trillion over the last five years, compared to an increase in nominal GDP of $2.7 trillion.
“In other words, America is having to borrow more to keep the growth show on the road and getting diminishing returns from every buck it borrows.
| US$ billion |
|
| ||||
US debt | 2013 | 2014 | 2015 | 2016 | 2017 |
| 5-year change |
Federal | 17,156 | 18,141 | 18,922 | 19,977 | 20,245 |
| 3,089 |
State * | 3,078 | 3,038 | 3,047 | 3,077 | 3,037 |
| (41) |
Total Government * | 20,234 | 21,180 | 21,969 | 23,054 | 23,282 |
| 3,048 |
|
|
|
|
|
|
|
|
Mortgage | 13,328 | 13,480 | 13,874 | 14,360 | 14,746 |
| 1,419 |
Auto | 879 | 958 | 1,001 | 1,073 | 1,114 |
| 235 |
Credit card / other | 857 | 891 | 910 | 970 | 1,028 |
| 171 |
Student | 1,146 | 1,236 | 1,320 | 1,408 | 1,491 |
| 345 |
Total Consumer | 16,209 | 16,566 | 17,105 | 17,811 | 18,379 |
| 2,170 |
|
|
|
|
|
|
|
|
Non-financial corporate debt securities | 4,802 | 5,114 | 5,520 | 5,810 | 6,088 |
| 1,286 |
Financial corporate debt securities ** | 12,292 | 13,063 | 13,040 | 13,353 | 13,353 |
| 1,061 |
Corporate debt | 17,094 | 18,177 | 18,561 | 19,163 | 19,441 |
| 2,347 |
|
|
|
|
|
|
|
|
Total Debt | 53,537 | 55,923 | 57,634 | 60,028 | 61,102 |
| 7,565 |
US GDP | 16,692 | 17,428 | 18,121 | 18,624 | 19,387 |
| 2,695 |
Source: FRED, St. Louis Federal Reserve database, Federal Reserve G.19 Consumer Credit report, Federal Reserve of New York. *Excludes pension obligations and Medicare. **2017 full-year data not yet available
“This is why it is far too early to judge whether Janet Yellen has left her successor as chair of the Federal Reserve, Jay Powell, a good legacy or not (even if she can hardly be blamed for Government profligacy and the pork barrel politics which seem to dominate Capitol Hill.
“The Fed is, in theory, on course to raise interest rates three times, or by three-quarters of a percent, to 2.25% by year end.
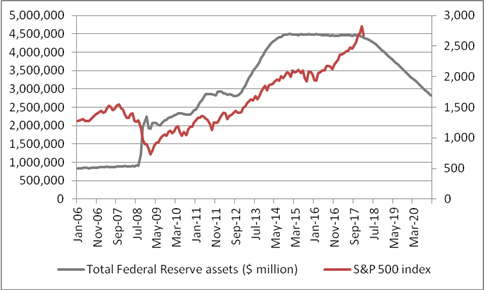
“But Mr Powell may find himself trying to do so at a time when the Government is looking to borrow more – and issue more Treasuries – just when the biggest buyer has disappeared, as the Fed switches from Quantitative Easing to Quantitative Tightening.
“The Fed is looking to reduce its holdings by as much as $450 billion this year - $20 billion a month in Q1, $30 billion a month in Q2, $40 billion a month in Q3 and $50 billion a month from then on.
“This could be the real reason why bond yields are rising (and prices falling), with a knock-on effect upon stocks. It might not be inflation fears, but rather the slow-but-steady withdrawal of stimulus by the Fed, a situation which leaves Mr Powell with a very tricky balancing act indeed.”
Source: FRED, St Louis Federal Reserve database; Thomson Reuters Datastream. Figures from Feb 2018 onwards are based on QE withdrawal timeline outlined by the US Federal Reserve in June 2016.