“The FTSE 100 is up by just 1% over the past 12 months but that still beats what the Big Five banks have achieved, with Lloyds the best of them, down 1%, and Barclays the worst, with a 23% drop. That raises the stakes for the first-quarter reporting season, which begins with Barclays on Thursday 25th, especially after the results served up by the US megabanks for the first three months of the year were mixed at best,” says AJ Bell Investment Director Russ Mould. “The banks’ earnings statements are always packed with detail but investors should focus on three particular sets of numbers when they try to assess not just the quantity but the quality of their results. They are net interest margins, costs and the trend in bad loans.
• Net interest margins. At its core, banking is a simple business. The bank raises funds at a certain cost and then lends those funds out at a higher interest rate, pocketing the difference as a profit. This is, in effect, net interest income. The banks can also generate earnings through fees (as they do via say wealth management, private banking or insurance) or commissions and trading (via investment banking) but at their core it is lending that matters. If you cannot get this right, then you should not be in the business.
Analysts – and the banks themselves – have been expecting net interest margins to rise as interest rate rise. But interest rates have hardly gone up at all and net interest margins have either contracted or increased more slowly than hoped. This is because the banks have faced higher funding costs on one side (as they offer higher deposit rates to attract customers, lose the cheap Term Funding Scheme cash from the Bank of England that expired last year and encounter greater wholesale costs as lenders fight shy of the UK pre-Brexit) and pricing pressure on the other, as lenders compete to offer mortgages and loans.
Lloyds seems to be doing the best job of countering these headwinds but further progress is needed if banks’ earnings are to start powering higher.
|
|
Net interest margin |
||||||||
|
|
2010 |
2011 |
2012 |
2013 |
2014 |
2015 |
2016 |
2017 |
2018 |
|
HSBC |
2.68% |
2.51% |
2.32% |
2.13% |
1.94% |
1.88% |
1.73% |
1.63% |
1.66% |
|
Standard Chartered |
2.20% |
2.30% |
2.30% |
2.10% |
1.90% |
2.08% |
2.00% |
1.55% |
1.58% |
|
RBS |
2.23% |
2.16% |
2.16% |
2.01% |
2.23% |
2.12% |
2.18% |
2.13% |
1.98% |
|
Lloyds |
2.48% |
2.42% |
1.93% |
2.12% |
2.45% |
2.63% |
2.71% |
2.86% |
2.93% |
|
Barclays UK |
|
|
|
|
|
3.56% |
3.62% |
3.49% |
3.23% |
Source: Company accounts
• Costs. Since 2013, the Big Five have spent £24.3 billion in restructuring costs, designed to slim down cost bases and drive efficiencies. There has been some progress here, but perhaps not as much as hoped, not least because costs such as the UK bank levy and litigation and conduct charges have refused to go away. In addition, the banks are having to invest heavily to improve their online and digital offerings, as well as boosting their cybersecurity, in the face of competition from challenger banks and fintech start-ups.
One measure that investors can follow here is the cost-to-income ratio. This takes total operating expenses and divides them by net operating income, although some banks can adjust these numbers for loan impairment and other risk-related provisions. Substantial changes in business structure and different business mixes (such as investment banking, where the cost of talent retention can be high) also make direct comparisons difficult, but most of the banks have shown some progress here – even if perhaps not as much as they had hoped.
|
|
Cost/income or cost efficiency ratio (%) |
||||||||
|
|
2010 |
2011 |
2012 |
2013 |
2014 |
2015 |
2016 |
2017 |
2018 |
|
HSBC |
52.0% |
55.2% |
57.5% |
62.8% |
59.6% |
67.3% |
61.7% |
60.9% |
61.0% |
|
Standard Chartered |
51.3% |
55.9% |
56.5% |
53.8% |
54.4% |
58.9% |
67.8% |
72.6% |
72.2% |
|
RBS |
53.0% |
56.0% |
60.0% |
59.0% |
95.0% |
87.0% |
127.0% |
129.0% |
79.0% |
|
Lloyds |
48.4% |
49.4% |
49.6% |
55.1% |
52.9% |
51.2% |
49.3% |
48.7% |
51.8% |
|
Barclays UK |
|
|
|
|
79.0% |
81.0% |
84.0% |
76.0% |
66.0% |
Source: Company accounts
• Bad loans. Aggregate charges for loans that had gone sour came to just £4.8 billion in 2018, a lot lower than in recent years. Sceptics could argue that the only way is up from here, especially if the UK economy and its housing market start to turn lower. But supporters of the sector will be looking to the banks to lend sensibly, manage risk and thus keep impairments at these welcome low levels. If they can, then profits could rise, especially if net interest margins increase to boost income and costs are kept under control.
|
|
Loan and credit and other impairments (£ million) |
|||||
|
|
2013 |
2014 |
2015 |
2016 |
2017 |
2018 |
|
HSBC |
3,508 |
2,358 |
2,473 |
2,456 |
1,338 |
1,348 |
|
Standard Chartered |
1,021 |
1,316 |
2,644 |
2,082 |
1,223 |
630 |
|
RBS |
8,432 |
(1,201) |
(727) |
478 |
493 |
398 |
|
Lloyds |
3,004 |
1,177 |
568 |
682 |
795 |
937 |
|
Barclays |
1,659 |
2,168 |
2,114 |
2,373 |
4,531 |
1,468 |
Source: Company accounts
“That combination could also help to persuade investors that the banks are cheap, especially after the sell-off seen over the past year. Three of the Big Five sell at a discount to book, or net asset value, so in theory if you bought them, sold off the assets and paid off their debts and liabilities you would automatically make a profit.
|
|
2019E |
2018 |
2019E |
2019E |
Net interest |
Cost/income |
Impairment |
2018 |
CET1 |
|
|
P/E |
Price/book |
Dividend yield |
Dividend cover |
margin (%) |
ratio (%) |
ratio (%) |
RoTE |
ratio |
|
HBSC |
11.4 x |
1.21 x |
6.0% |
1.47 x |
1.66% |
60.5% |
0.19% |
8.6% |
8.6% |
|
Lloyds |
8.9 x |
1.24 x |
5.3% |
2.15 x |
2.93% |
49.3% |
0.21% |
11.7% |
11.7% |
|
RBS |
9.5 x |
0.91 x |
4.6% |
2.28 x |
1.98% |
71.7% |
0.13% |
4.8% |
4.8% |
|
Standard Chartered |
13.1 x |
0.74 x |
2.4% |
3.26 x |
1.58% |
78.8% |
0.28% |
5.1% |
5.1% |
|
Barclays |
7.6 x |
0.64 x |
4.5% |
2.94 x |
3.23% |
62.0% |
0.44% |
8.5% |
8.5% |
Source: Company accounts for 2018 book value and return on tangible equity (RoTE) figures, Webfg and consensus analysts forecast for 2019 earnings and dividend forecasts, Refinitiv data
“In practice it would not be that simple and stocks often trade on a discount to net asset value for a good reason: the assets may be hard to value or difficult to sell, they may be generating weak returns (with Return on Equity one benchmark here) or investors may fear that the assets are primed to fall in value.
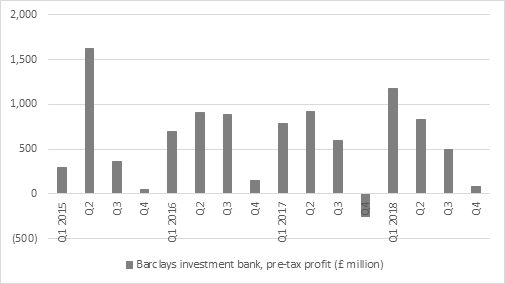
“The burden of proof rests with the banks and making progress with net interest margins, restraining costs and keeping loan impairments to a minimum would all be steps toward persuading the doubters, although in the case of Barclays and HSBC the performance of their investment banks will come in for further scrutiny as well, especially at Barclays, where the unit sits as the centre of Sherborne’s activist campaign. Barclays’ investment bank started 2018 with a bumper first-quarter and pre-tax profits of nearly £1.2 billion but its results tailed off pretty badly from there.”
Source: Company accounts
