“Markets remain thrall to President Donald Trump’s Twitter feed and they are flip-flopping from day to day in response to news, hope and speculation about the trade talks with China are going. To accentuate the positive, the S&P 500 is still within 3% of April’s all-time high, but if you take a step further back, the index is no higher now than it was in January 2018,” says Russ Mould, AJ Bell Investment Director. “That may just give bulls of US stocks pause for thought, especially as Fed policy remains accommodative, economic growth is robust and hopes remain high for both a trade deal and second-half earnings growth. This does perhaps beg the question of what could happen if anything goes wrong.
“Some might suggest that the cool reception given to the much-hyped Lyft and Uber stock market flotations is a sign of trouble ahead, while chartists may be tempted to argue that a ‘triple-top’ pattern is emerging in the benchmark S&P 500 index.
“Technical analysis does not appeal to everyone but the S&P 500’s failure to make much progress over the last 17 months, even with so much apparently going for it, does bring to mind the old adage that ‘market tops are a process, market bottoms are an event.’
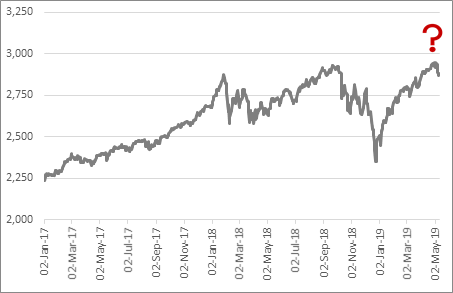
Source: Refinitiv data
The case for US equities
“Supporters of US exposure will argue that American equities are far from excessively valued on around 18 times earnings for 2019, based on consensus analysts’ forecasts, for three good reasons.
• The economy looks like one of the best performers in the Western World
• US corporate earnings are forecast by analysts to rise 9% this year and 12% next
• The Federal Reserve is running very accommodative monetary policy, with interest rates held at just 2.5% (below the first-quarter’s annualised GDP growth rate of 3.2%) and Quantitative Tightening due to come to a halt in the autumn.
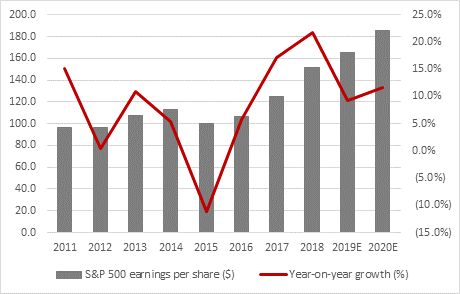
Source: Standard & Poor’s
• The Federal Reserve is running a very loose monetary policy, with interest rates held at just 2.5% (below the first-quarter’s annualised GDP growth rate of 3.2%) and Quantitative Tightening due to come to a halt in the autumn. This could help to sustain economic growth and also continue to drive investors toward equities, given the relatively poor returns on offer from cash and bonds.
The case against US equities
There are counterarguments.
• Profit forecasts for 2019 are back-end loaded. Earnings growth is expected to surge from 1% to 5% year-on-year in the first three quarters to 27% in the fourth. Some allowance can be made for the base effect created by the December 2017 Trump tax cuts but this may be why markets think the trade talks with China are so important. If they go wrong, tariffs are applied, China retaliates and global growth slows then those second-half forecasts could look exposed and leave US stocks looking expensive.
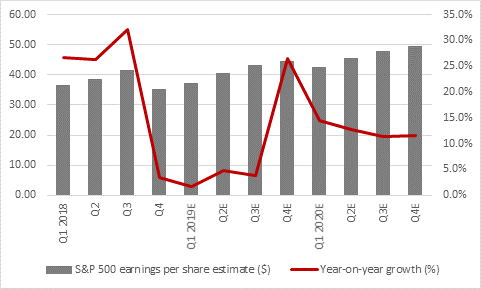
Source: Standard & Poor’s
• US corporate profits stand at a record high, so US stocks could start to look very expensive very quickly if there is a surprise economic slowdown or loss of momentum in corporate earnings growth. Also note that US corporate profits as a percentage of GDP peaked in 2012 to suggest that some margin pressure, in the form of wage growth, is already creeping in.
• Adherents of Professor Robert Shiller’s cyclically-adjusted price/earnings (CAPE) ratio puts US stocks on 30 times earnings. They have only been more expensive twice in their history and those episodes – 1929 and 2000 – did not end well for advisers and clients. Those who doubt Shiller’s data argue that CAPE is a poor market-timing tool. In the short term they are absolutely right but on ten-year view lofty CAPE ratios have consistently warned of poor future returns.
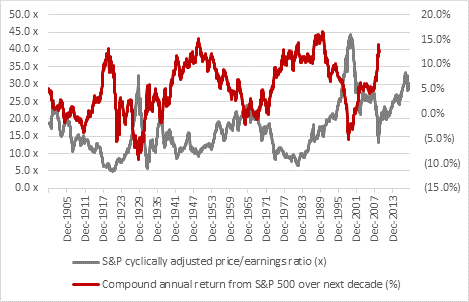
Source: http://www.econ.yale.edu/~shiller/data.htm
Final thoughts
“It is tempting when all else fails to rely on Federal Reserve, especially as the US central bank’s policy U-turn in January, when it stopped promising higher interest rates, followed some hefty stock market falls.
“But even a cursory glance at the 2000-03 and 2007-09 bear markets shows that the Fed cut rates aggressively and it initially made no difference. Share prices still collapsed because valuations were stretched, earnings were disappointing and the economy was tipping over.
|
First rate cut |
First rate cut |
S&P 500 performance after first rate cut by Fed |
|||
|
Date |
From |
3 months |
6 Months |
1 Year |
2 years |
|
Jan-1971 |
4.50% |
10.1% |
8.6% |
11.7% |
29.7% |
|
Jul-1974 |
11.00% |
(23.5%) |
(20.3%) |
(8.1%) |
(0.1%) |
|
Jul-1981 |
19.00% |
(5.4%) |
(7.3%) |
(16.4%) |
30.7% |
|
Aug-1984 |
11.56% |
(1.8%) |
8.8% |
13.2% |
51.8% |
|
Jun-1989 |
9.81% |
7.7% |
7.5% |
12.6% |
18.3% |
|
Jul-1995 |
6.00% |
5.1% |
11.3% |
18.7% |
65.5% |
|
Jan-2001 |
6.50% |
(17.9%) |
(8.4%) |
(13.5%) |
(32.6%) |
|
Sep-2007 |
5.25% |
(4.3%) |
(12.4%) |
(20.6%) |
(29.7%) |
|
AVERAGE |
|
(3.7%) |
(1.5%) |
(0.3%) |
16.7% |
Source: Refinitiv data
“Buyers of US equities seem happy to rely on the support of the Fed, President Trump and for that matter President Xi, in the view that the central bank will ride to their rescue in the event anything goes wrong and that both leaders want – and need – a trade deal.
“It is to be hoped that they are right. Another tried-and-tested saying is that ‘Markets go up on the escalator and come down in the elevator.’ The bull run that began in March 2009 has generally been pretty smooth, with very few bumps along the way to back up the first half of that adage but how many investors are prepared for the second half remains open to question.”
