“The shares are falling back to levels last seen in November 2015, just as the company was embarking upon its acquisition spree to provide investors with three valuable reminders of what to look for (and what to avoid) when it comes to assessing a stock as a potential investment.
Do not be swayed by share buybacks and executives’ declarations of indignation about how cheap their shares are.
“The £100 million buyback launched by Mr Vervaat and his team last July has offered no sustained support to the share price, after the initial flurry of interest it created last summer and this should be no surprise - ultimately it is executives’ job to manage the assets under their control rather than the share price. Too many share buybacks fall into the latter camp and can leave management actually allocating capital in an inefficient way, not least because that precious cash is now gone for good.
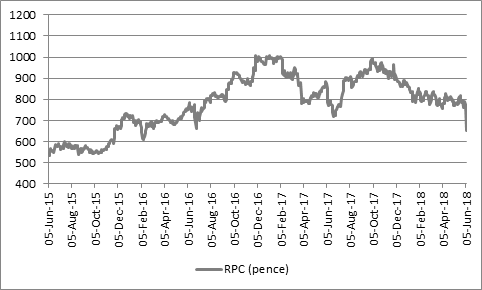
Source: Thomson Reuters Datastream
“If they do a good job, the share price will take care of itself over time, as the company builds and develops and protects its competitive position, husbands its resources well, focuses on long-term risk and reward when it invests and ultimately generates the free cash flow which funds healthy dividend payments for shareholders. At least the twenty-fifth consecutive increase in the annual dividend offers some comfort here and the statutory earnings per share number of 61.3p still covers the 28p payout by more than two times.
Always be wary of companies that make serial acquisitions
“The best strategies use acquisitions to supplement existing momentum in the business rather than create it and the good news is that RPC made just one acquisition in its last fiscal year at a cost of just £65 million, compared to nine for £938 million in the fiscal 2016-17.
“The bad news is that the lack of deals provides better insight into the underlying, organic rate of sales growth, which was just 2.8% last year. Moreover, cash flow grew more slowly than operating profit as the company said it could not repeat improvements in working capital that had resulted from the integration of prior deals.
“Moreover, Mr Vervaat appears to be back on the deal-making trail, noting that ‘the Group will continue to assess value-adding acquisition opportunities which meet our strict acquisition criteria.’ As such the company has not been able to stop making deals for long. This is perhaps no surprise given how relatively pedestrian underlying growth looks.
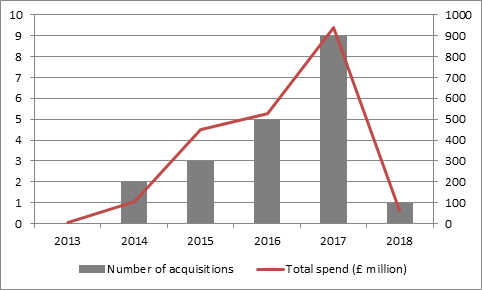
Source: Company accounts. Year to March.
Always focus on the quality of earnings and not just the quantity, especially when management teams focus on ‘adjusted’ earnings rather than statutory ones.
“Acquisitions can bulk up the quantity of earnings but they may not improve its quality.
“The good news is that RPC has not restated its historic accounts for the third time in a row, after a depressing run when it did so, also for three straight years. In addition, the gap between stated and ‘adjusted’ earnings is also closing up, although this perhaps reflects the slower pace of acquisitions and the restructuring charges and write-downs which can flatter future growth rates once they have been booked.
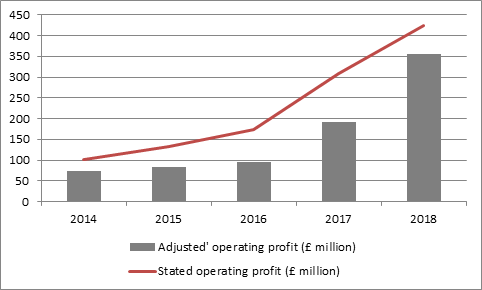
Source: Company accounts. Year to March.
“Less encouragingly, cash flow growth remains volatile, especially relative to sales and profits growth. In addition, operating free cash flow as a percentage of sales is no higher now than it was in fiscal 2013-14, despite the acquisition spree.”
£ million | 2014 | 2015 | 2016 | 2017 | 2018 |
|
|
|
|
|
|
Sales | 1,047 | 1,222 | 1,642 | 2,747 | 3,748 |
EBIT | 73 | 83 | 95 | 192 | 356 |
Depreciation | 43 | 54 | 74 | 130 | 162 |
Amortisation | 8 | 7 | 3 | 3 | 4 |
Impairment losses | 7 | 4 | 12 | 1 | 0 |
NWC | 12 | 0 | 0 | 29 | (22) |
Capex | (70) | (92) | (101) | (175) | (241) |
OpFcF | 73 | 57 | 83 | 180 | 258 |
|
|
|
|
|
|
Year-on-year change | |||||
Sales | 7% | 17% | 34% | 67% | 36% |
EBIT | 18% | 14% | 14% | 102% | 85% |
OpFcF | 21% | (22%) | 47% | 116% | 43% |
|
|
|
|
|
|
As % sales | |||||
EBIT | 7.0% | 6.8% | 5.8% | 7.0% | 9.5% |
OpFcF | 6.9% | 4.6% | 5.1% | 6.5% | 6.9% |
Source: Company accounts. Year to March.