“The combination of the Government’s Help to Buy scheme and extension to the stamp duty holiday, plus people’s desire for bigger houses (so they can work from home) and the ongoing shortage of dwellings relative to demand means that house prices keep rising – and that is meat and drink to housebuilders,” says AJ Bell Investment Director Russ Mould. “Bellway now expects its average selling price to exceed £300,000 for its current financial year, for an increase of around 3%, as volumes reach around 10,000 completions - well above the pandemic hit performance of last year but still below the 12-month period before that.
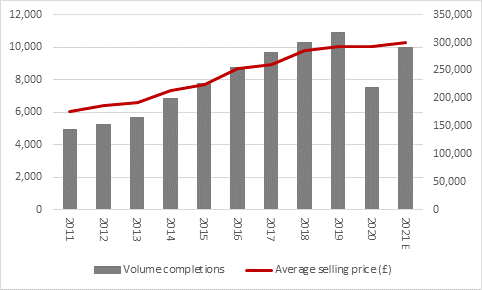
Source: Company accounts, company guidance alongside 18 June trading statement. Financial year to June.
“News on the better-than-expected pricing may give analysts some scope to upgrade their earnings forecasts yet again and Bellway is laying the groundwork for further increases in completions – and thus profits – as it acquired fresh land.
“Buying land is the key to being a successful builder, buying it cheaply at the right time in the cycle all the more so as that helps builders to lock in the benefit of any future increases in land values and prices – although they will have to keep a wary eye on input cost inflation, an issue that Bellway does flag, even if it seems manageable for the moment.
“Bellway’s £408 million net cash pile gives it the financial flexibility to swoop for land when it can. That should help to underpin consensus forecasts of future profit growth and margin expansion, also despite input cost increases, although analysts seem reluctant to assume that stated margins return to pre-pandemic levels. This may reflect caution over possible raw material and wage increases, any ongoing costs associated with flammable cladding and safety improvements at certain apartment schemes, plus the possibility that housing demand may cool if, as and when Government incentive schemes finally lapse – although multiple extensions do imply a certain reluctance in Whitehall to let that happen, for political or economic reasons.
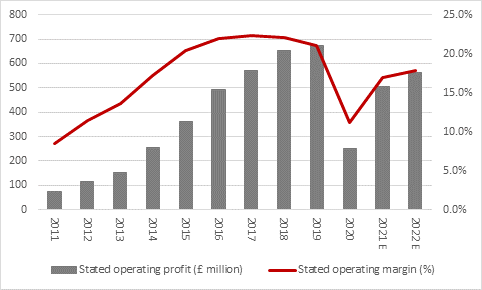
Source: Company accounts, Marketscreener, analysts’ consensus forecasts. Financial year to June.
“With demand seemingly set fair, Government willing to support (although some would say interfere with) the market and the possibility of inflation coming around to the corner – to the potential benefit of owners of ‘real’ assets such as land – the picture for housebuilders, and their shareholders seems bright enough. Bellway looks capable of handing more cash back to shareholders as dividends, even after its land buying.
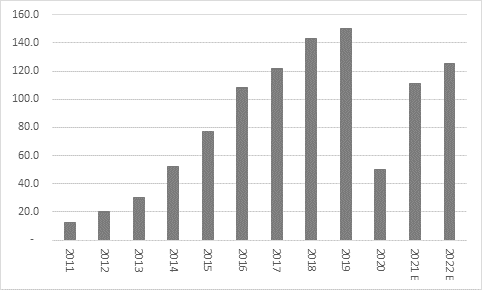
Source: Company accounts, Marketscreener, analysts’ consensus forecasts. Financial year to June.
“Analysts’ forecasts put Bellway on a forward dividend yield of 3.2% for the year ending June 2021 and 3.6% for June 2022.
“Both figures represent a discount to the wider housebuilding sector, although Bellway is one of the cheaper stocks on a price/earnings and also a price/book value basis.
“House builders tend to trade near to one times book value during bad times and closer to two times (or more) during good times. On the basis, Bellway does not look unduly expensive, and again this perhaps reflects lingering concerns about what may happen to housing demand when the stamp duty holiday and Help to Buy finally come to an end.”
|
|
Historic |
2021E |
2022E |
2021E |
2022E |
2021E |
2022E |
|
|
Price/NAV(x) |
PE (x) |
PE (x) |
Dividend yield (%) |
Dividend yield (%) |
Dividend cover (x) |
Dividend cover (x) |
|
Vistry |
1.23 x |
10.2 x |
8.8 x |
4.0% |
5.3% |
2.45 x |
2.15 x |
|
Redrow |
1.28 x |
10.0 x |
9.1 x |
2.9% |
3.6% |
3.47 x |
3.04 x |
|
Crest Nicholson |
1.29 x |
16.1 x |
11.6 x |
2.5% |
3.4% |
2.50 x |
2.57 x |
|
Bellway |
1.36 x |
10.9 x |
9.6 x |
3.2% |
3.6% |
2.87 x |
2.90 x |
|
Barratt |
1.45 x |
11.6 x |
9.9 x |
3.8% |
5.1% |
2.29 x |
1.97 x |
|
Taylor Wimpey |
1.52 x |
11.2 x |
8.8 x |
4.5% |
7.2% |
1.96 x |
1.58 x |
|
Berkeley |
1.86 x |
13.5 x |
12.9 x |
4.9% |
5.0% |
1.50 x |
1.56 x |
|
Countryside Properties |
2.32 x |
23.8 x |
13.9 x |
1.4% |
2.6% |
3.00 x |
2.77 x |
|
Persimmon |
2.81 x |
12.9 x |
12.0 x |
7.6% |
7.6% |
1.03 x |
1.10 x |
|
AVERAGE |
1.69 x |
12.2 x |
12.2 x |
4.7% |
5.5% |
1.75 x |
1.71 x |
Source: Company accounts, Marketscreener, consensus analysts’ forecasts, Refinitiv data
