The gap between stated and adjusted operating profit for FTSE 100 firms is at its highest level in a decade
New analysis highlights the importance of understanding how companies report a profit as well as how they make it
How to spot the next profits accident before it happens – five point checklist for investors
Gap between FTSE 100 stated and adjusted operating profit was 51% in 2016
New research by AJ Bell, using the last 10 years report and accounts for every FTSE 100 firm, shows that the gap between stated (or statutory) operating profit and how companies prefer to present the same figure (either on an adjusted, pro forma or underlying basis) is at its highest level in a decade.
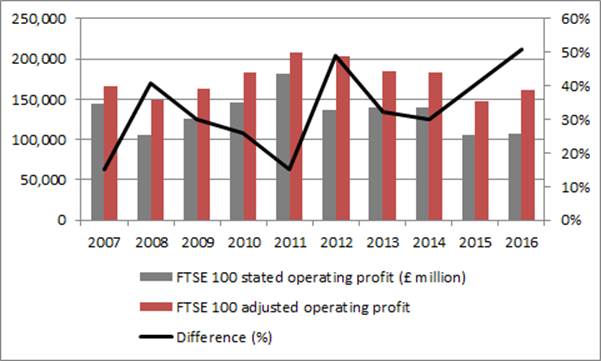
Source: FTSE 100 companies’ Annual Report and Accounts in aggregate, 2007-2016
Russ Mould, investment director at AJ Bell, comments:
“There are two, conflicting, possible interpretations for this trend.
“Either, companies are simply being more transparent, providing greater clarity to shareholders on the many moving parts which make up their business and enabling investors to get a better view of what is really going on under the bonnet.
“Or, companies are instead intentionally muddying the waters. Some even present sales figures in multiple formats of actual, underlying and underlying in constant currencies. Others point to underlying metrics of their own choosing and publish those figures first in regulatory announcements (while at least flagging that they are not based on generally accepted accounting principles, or GAAP). In both cases the goal is to put a positive gloss on their figures. The end result may therefore be a higher share price (to enhance the value of executives’ shareholdings) or a profit metric which helps management to hit targets and trigger further bonuses or share and stock option awards.
“However you interpret it, one thing that is clear is that accounting practices and the way companies report their numbers is coming under greater scrutiny. Britain's accounting watchdog has said it is investigating the audits conducted by Deloitte regarding two of the annual financial statements of outsourcing services supplier Mitie, which adds to the ongoing debate over the role of auditors in the wake of the accounting scandal at BT’s operations in Italy. In addition, Unilever has moved to trigger management share awards off underlying earnings and there have been shareholder protests over executive pay packets at Smith & Nephew, Burberry and Persimmon.
“All of this flags the importance of understanding how companies not just make a profit but how they present and report it. Investors need to be even more diligent than ever when it comes to doing their research. Ultimately clarity and consistency of reporting standards are a good sign. Restatements and obfuscation are not.”
How to spot the next profits accident before it happens – five point checklist for investors
A big gap between stated and adjusted earnings does not necessarily mean a company is inherently a poor investment. Investors still need to assess its competitive position, financial strength and management acumen and checking the accounts can be a useful way to judge the quality as well as the quantity of profits and cash flow.
To protect themselves, and their portfolios, investors can apply the following five checks:
Watch out for frequent “exceptional” items (an oxymoron if ever there was one) or a growing gap between stated and adjusted earnings. The Banks and Mining sectors are those where the gap between stated and adjusted earnings has been consistently large and performance has therefore been very mixed over the past decade. The gap grew quickly just before Tesco’s profit and accounting woes tripped up the shares in 2012-13 and stocks where the difference between adjusted and stated profits at the operating level has begun to creep higher of late include AstraZeneca, Babcock, BT, GKN, GlaxoSmithKline, Imperial Brands, ITV, Marks & Spencer and Shire. In some cases acquisitions explain the disparity but frequent deals can be a red flag in themselves and good reason to pay a lower multiple until the purchases prove themselves.
Watch out for restated numbers, unclear numbers or unintelligible commentary. As an equity investor, your time horizon should be five to ten years at least, as this is when the power of dividend reinvestment really makes itself felt. Yet depressingly few firms provide a clear 10-year history of their numbers in the Report and Accounts (British Land, GKN and Hammerson deserve praise here). Those firms which restate the numbers or feature a much more limited history or emphasise adjusted over restated earnings should be given further scrutiny and potentially a discount rating relative to the wider UK market.
Make sure you know what triggers management bonuses, share awards and stock options. These thresholds are designed to focus executives’ minds and align their interests with those of shareholders but there is a risk that they start to become an end in themselves (as rather happened at FTSE 250 house builder Bovis in 2016). As Warren Buffett’s long-time business partner Charlie Munger once noted: “Show me the incentive and I will show you the outcome.” Investors therefore need to check these triggers, particularly if they are changed and particularly if they are structured so that they are based on underlying or adjusted profit figures, as a management team may be tempted to focus on short-term pay triggers (“managing the numbers”) rather than doing what they should be, which is deepening a company’s competitive position (“managing the assets.”)
Apply the rule of three. If sales, operating profit and cash flow all grow consistently, and at broadly similar rates, the chances are the company is a very solid one, with a strong competitive position, pricing power and a reliable set of accounts for good measure. If sales and profits grow but cash flow lags (or does not grow at all) then more research is required to ensure the company is not flattering its reported numbers, perhaps through aggressive revenue recognition.
Go by the book. Net asset value (NAV) measures what investors collectively own through their shareholdings – it is the total assets of a company minus its liabilities and represents what would be left if the firm were wound up today. Companies that consistently grow earnings will grow NAV over time. Those which conjure profits from accounting manoeuvres, or frequently take asset write-downs to cover restructuring operations, especially after acquisitions, may not – especially if the acquisitions prove to be a dud or over-priced or mismanaged. NAV per share growth is also important as those firms which liberally issue new shares, to raise much-needed cash or fund deals, can dilute down existing shareholders.
One test of the quality and reliability of a company’s earnings is therefore growth in NAV per share, especially when coupled with the gap between adjusted and stated profits. The table below shows the top 5 and bottom 5 FTSE 100 firms in terms of total shareholder returns (capital gains plus reinvested dividends) from 1 July 2007 to 1 July 2017 and compares that to NAV growth and the adjusted/stated operating profits gap between 2007 and 2016.
While some allowances need to be made for the impact of acquisitions and disposals, it is noticeably clear that:
Within the top 5, all of the companies generated healthy growth in NAV per share and four showed very little variance between stated and adjusted operating profit, to suggest the quality as well as the quantity of their earnings is relatively high.
Within the bottom 5, four saw a drop in NAV per share over the period and they all showed a big variance between stated and adjusted operating profit.
| 10-year total return (%) | 10-year NAV per share growth | 10-year operating profit gap (%) |
Top 5 | |||
Ashtead | 1200.8% | 352.8% | 6.0%% |
Micro Focus | 1027.8% | 2,399.0% | 48.1%% |
Hargreaves Lansdown | 780.5% | 471.1% | 4.3%% |
Croda | 671.4% | 188.9% | 2.3% |
Randgold Resources | 569.0% | 661.1% | 0.0% |
|
|
|
|
Bottom 5 | |||
Tesco | (46.3%) | (48.0%) | 43.2% |
Barclays | (57.1%) | (16.2%) | 24.8% |
Anglo American | (58.8%) | 50.4% | 38.9% |
Lloyds | (69.6%) | (72.2%) | 392.5% |
Royal Bank of Scotland | (95.0%) | (47.8%) | 51.7% |
|
|
|
|
FTSE 100 average | 62.6% | 73.2% | 31.5% |
If these five scratch and sniff tests mean the investor is not satisfied at the end, they have two options, either:
Avoid the shares altogether (or sell them if they own them).
Pay a discount valuation, relative to sector peers or the wider stock market, until their qualitative doubts are soothed.