“AstraZeneca is one of just 11 FTSE 100 firms whose shares have risen so far in 2020 and the pharmaceutical giant’s first-quarter results and full-year outlook help to explain why it is the sixth-best performer in the index so far this year,” says Russ Mould, AJ Bell Investment Director. “Sales rose 16% year-on-year, earnings per share handily beat forecasts on a stated and an adjusted basis and cash flow from operations was stronger than in the first three months of 2018 and 2019, to offer the prospect of some solace for income-seekers, since AstraZeneca was the seventh-biggest dividend payer in the FTSE in 2019.
|
11 FTSE firms to have provided share price gains to date in 2020 |
|
|
|
Year-to-date capital return |
|
Polymetal |
40.2% |
|
Ocado |
27.0% |
|
Hikma Pharmaceuticals |
14.9% |
|
Scottish Mortgage Inv. Trust |
12.6% |
|
Fresnillo |
12.5% |
|
AstraZeneca |
8.8% |
|
Pennon |
7.6% |
|
Reckitt Benckiser |
5.1% |
|
Rentokil Initial |
4.6% |
|
Flutter Entertainment |
1.8% |
|
Admiral |
1.6% |
Source: Refinitiv data
“AstraZeneca’s status as a relatively defensive play during a period of great economic uncertainty is helping its share price, but the firm’s operational performance offers plenty of encouragement too, even if stockpiling of drugs in the near term is providing a near-term boost which is unlikely to carry through the whole of 2020.
“Treatments such as Tagrisso, Imfinzi and Lynparza for cancer and Symbicort for respiratory diseases continue to strongly drive sales and help offset declines in long-time stalwarts such as Pulmicort, Nexium and Crestor which are now open to competition from generic rivals.
|
|
Q2 2019 |
Q3 |
Q4 |
Q1 2020 |
|
Oncology |
51% |
46% |
29% |
33% |
|
New CVRM |
9% |
8% |
6% |
7% |
|
Respiratory |
2% |
15% |
13% |
21% |
|
Biopharmaceuticals |
5% |
12% |
10% |
15% |
|
Other medicines |
(11%) |
(9%) |
(17%) |
(8%) |
|
Product sales |
14% |
16% |
8% |
15% |
|
Collaboration |
(17%) |
n/a |
(36%) |
4% |
|
Total revenue |
13% |
20% |
4% |
16% |
Source: Company accounts
“The good start to the year means AstraZeneca affirmed its full-year sales growth expectation, with the top line expected to grow in the high single digits or lower double-digits on a percentage basis for 2020 as a whole.
“The first three months also got the year off to a good start earnings wise. Stated Q1 earnings per share (EPS) of $0.59 easily beat last year’s $0.49 figure and analysts forecasts of $0.49 while adjusted, or core, EPS also advanced smartly.
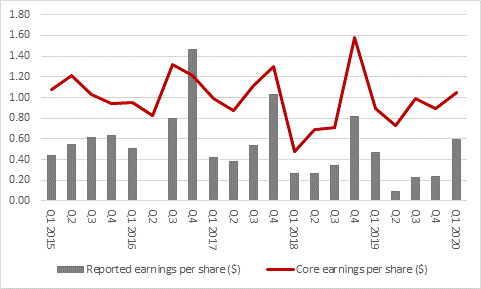
Source: Company accounts
“AstraZeneca’s quarterly earnings are quite volatile but a promising growth trend appears to be developing and investors will be looking for this to feed through to cash flow, as it is cash flow that funds the company dividend.
“The drug giant generated positive cash flow from operations in Q1, in contrast to the outflows of the prior two years, so that is a good start.
“AstraZeneca’s $2.80-a-share annual dividend in 2019, paid $0.90 in the first half and $1.90 in the second, meant that the firm was the seventh highest dividend payer in the FTSE 100 last year, at 3.8% of the total. Based on a sterling-dollar exchange rate of $1.24, AstraZeneca’s dividend yield of 2.7% may not be the highest figure in the index, but income-seekers have come a cropper more than once chasing juicier yields in the past 12 to 24 months and they may come to value the drug firm’s shareholder distributions, assuming it offers more of the same in 2020.
“Free cash flow cover for the dividend has dipped in recent years, as AstraZeneca has worked to develop new drugs and replenish its pipeline as older, well-established treatments have gone off patent, so strong performance from its new range of products will offer some reassurance on the dividend front.”
|
|
2011 |
2012 |
2013 |
2014 |
2015 |
2016 |
2017 |
2018 |
2019 |
|
Sales |
33,591 |
27,973 |
25,711 |
26,095 |
24,708 |
23,002 |
22,465 |
22,090 |
24,384 |
|
Operating profit |
12,795 |
8,148 |
3,712 |
2,137 |
4,114 |
4,902 |
3,677 |
3,387 |
2,924 |
|
Depreciation & amortisation |
2,550 |
2,518 |
4,583 |
3,282 |
2,852 |
2,357 |
3,036 |
3,753 |
3,762 |
|
Net working capital |
(897) |
(706) |
166 |
2,508 |
(49) |
926 |
(50) |
(639) |
(346) |
|
Capital expenditure |
(3,201) |
(4,619) |
(2,058) |
(2,752) |
(2,788) |
(2,314) |
(1,620) |
(1,371) |
(2,460) |
|
Operating Free Cash Flow |
11,247 |
5,341 |
6,403 |
5,175 |
4,129 |
5,871 |
5,043 |
5,130 |
3,880 |
|
|
|
|
|
|
|
|
|
|
|
|
Tax |
(3,999) |
(2,043) |
(844) |
(1,201) |
(1,354) |
(412) |
(454) |
(537) |
(1,118) |
|
Interest |
(548) |
(545) |
(475) |
(533) |
(496) |
(677) |
(698) |
(676) |
(774) |
|
Pension contributiion |
0 |
0 |
0 |
0 |
0 |
0 |
0 |
0 |
0 |
|
Free cash flow |
10,699 |
4,796 |
5,928 |
4,642 |
3,633 |
5,194 |
4,345 |
4,454 |
3,106 |
|
|
|
|
|
|
|
|
|
|
|
|
Dividend |
3,764 |
3,665 |
3,461 |
3,521 |
3,517 |
3,518 |
3,519 |
3,484 |
3,592 |
|
Free cash flow dividend cover |
2.84 x |
1.31 x |
1.71 x |
1.32 x |
1.03 x |
1.48 x |
1.23 x |
1.28 x |
0.86 x |
Source: Company accounts
