“Non-farm payrolls fell by 33,000 according to the initial estimate for September, well below the 169,000 seen in September and the +82,000 consensus forecast. It seems likely that Hurricanes Harvey and Irma had a lot to do with that, although economists may be concerned by the marked loss of jobs in the restaurant trade, as that could still be a signal that US consumers are becoming increasingly stressed as their debts rise.
Source: US Bureau of Labor Statistics
“The Federal Open Markets Committee will also be disconcerted to see a substantial downward revision to the July number, from 189,000 to 138,000 (and the first estimate of 210,000). This adds to a growing trend of downward revisions, a pattern that is normally seen when the US economy and jobs market are losing momentum, not gathering it.
“However, the Fed will be cheered by three other figures:
The headline U-3 unemployment rate fell from 4.4% to 4.2%
The U-6 unemployment reading, which covers discouraged workers, those with a part-time post who want a full-time one and those who want a job but are not currently looking, came down to 8.3% from 8.6%, the best reading since May 2006
Even the labour participation rate rose to 63.1%. While this is still way lower than idea (and the UK equivalent is a lot nearer 75%) this was the highest reading since February 2014.
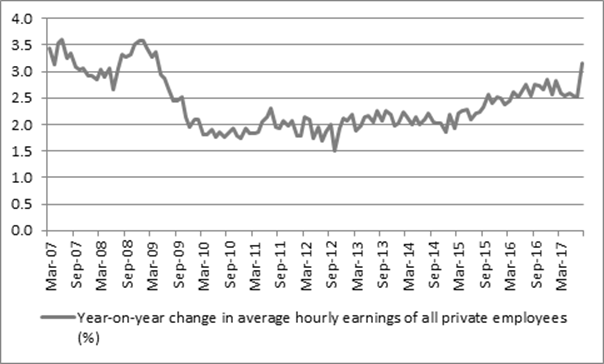
“Most powerfully of all, the Fed will note the acceleration in wage growth to 3.1%, as the average US hourly wage reached $26.55.
Source: US Bureau of Labor Statistics
“The rate of growth was the highest since 2009 and could trigger the Fed’s next rate hike. While markets are putting a 1.5% chance on a hike at the 1 November meeting, that percentage leaps to 97% in December, with the prospect of more to come in 2018.
“This could therefore represent a key test for US equities even as the S&P 500 sets a winning streak not seen since 1997 (when, perhaps coincidentally, all hell break loose with the Asian debt crisis and a savage correction in the autumn).
Record high US equity valuations can be justified by the current very high levels of corporate profits (more than 9% of GDP, relative to their long-run average just above 6%). Yet higher wages could start to erode those margins.
History shows that it has historically taken eight to nine US interest rate increases to derail an equity bull run as increased returns on cash and bonds suck cash out of stocks and higher interest costs suck profits away from companies. The Fed may be about to push through its fifth rate rise of this cycle, with maybe two or three more to come in 2018.
| S&P 500 | Fed funds rate | Change in Fed Funds cycle | Change in Fed Funds cycle |
Date | peak level | at S&P peak | Before peak | before S&P 500 peak |
11-Jan-73 | 120 | 5.50% | 3.50% to 5.50% | 2.00% |
21-Sep-76 | 1,008 | 5.50% | 4.75% to 5.50% | 0.75% |
28-Nov-80 | 141 | 15.00% | 4.75% to 15.00% | 10.25% |
10-Oct-83 | 173 | 9.38% | 8.50% to 9.38% | 0.88% |
25-Aug-87 | 337 | 6.63% | 5.88% to 6.75% | 0.88% |
16-Jul-90 | 369 | 8.00% | 9.81% to 8.00% | -1.81% |
24-Mar-00 | 1,527 | 6.00% | 4.75% to 6.00% | 1.25% |
09-Oct-07 | 1,565 | 4.75% | 1.00% to 4.25% | 3.25% |
|
|
|
|
|
Average |
|
|
| 2.18% |
Average excl. 1990 |
|
|
| 2.75% |
Source: Thomson Reuters Datastream
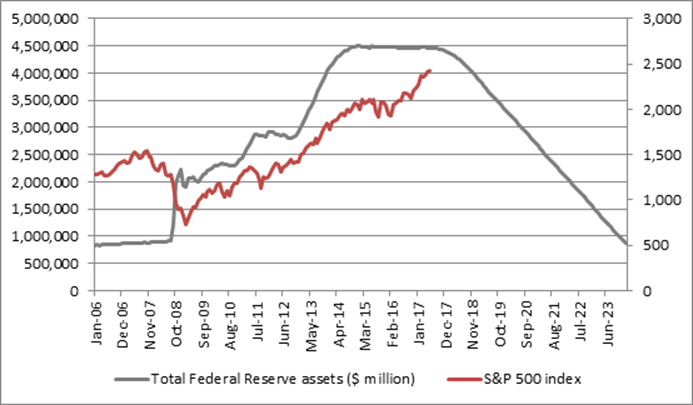
Finally, the Fed is about to embark upon Quantitative Tightening (QT) and start reducing its $4.5 trillion balance sheet. It can be argued that stocks have feasted upon QE, so there has to be a chance that QT has the opposite effect, at least unless economic growth and corporate earnings accelerate to take up any slack.
Source: FRED, St Louis Federal Reserve database; Thomson Reuters Datastream. Assumes Fed begins to withdraw QE from September 2017 onwards in amounts outlined by the June 2017 FOMC meeting.