• New survey* suggests, on average, regular annual pension freedoms withdrawals are 4.7% of fund value – almost a third lower than 12 months ago
• Savers appear to be reacting to market volatility and Brexit uncertainty, with expected investment returns down from 4.83% to 4.15%
• 1 in 10 pension drawdown investors have experienced a significant drop in fund value since entering drawdown, with around half cutting withdrawals as a result
• Pension freedoms are four years old on 6 April
Tom Selby, senior analyst at AJ Bell, comments:
“Pension freedoms investors appear to be responding sensibly to difficult market conditions and Brexit uncertainty. The fact many people are adjusting their investment expectations and cutting withdrawals in response to negative returns is an encouraging sign.
“With the FTSE100 expected to provide dividend returns of 4.9% in 2019, investors may be able to apply a ‘natural yield’ strategy and maintain their lifestyle in retirement without eroding their capital.
“This will, of course, rely on retirees taking sufficient risk and the underlying companies delivering the anticipated shareholder payouts.
“The majority of people aren’t entirely reliant on their personal pensions to provide an income in retirement, further suggesting current withdrawal levels are not a major worry.
“In fact, less than a third (30%) are relying on their personal pensions for over 40% of their annual income, while 40% of respondents say these withdrawals represent less than 10% of their income.”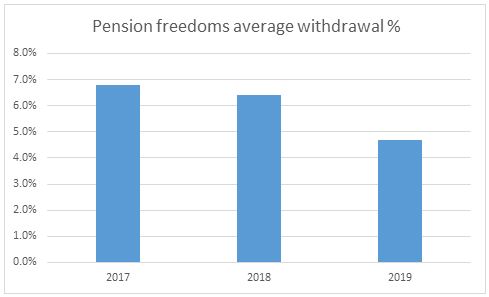
Pension freedoms ‘engagement gap’ remains
“Although there are signs of savers reviewing and adjusting retirement incomes in response to tough investment conditions, a worrying proportion are oblivious to how their underlying fund is performing.
“In our latest survey, 3 in 10 respondents admitted they didn’t know if they had experienced significant falls in their pension fund value since entering drawdown.
“These people are effectively relying on blind luck in ensuring their retirement income strategy remains sustainable.
“A sudden dip in the fortunes of their investments – and there is no shortage of potential economic shocks right now – could turn a sustainable-looking withdrawal strategy into a patently unsustainable one. It is for this reason that engagement in drawdown and regular portfolio reviews, ideally with the help of a regulated adviser, are absolutely essential.”
Banking on failure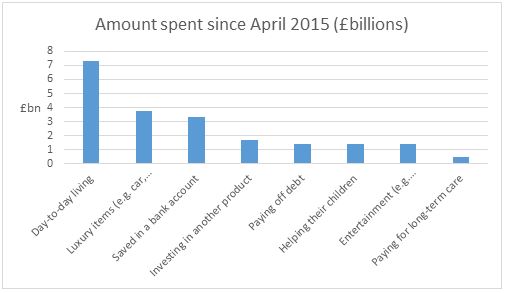
Note: Numbers estimated based on official HMRC pension freedoms data. Between Q2 2015 and Q4 2018, £23.6 billion worth of flexible withdrawals were recorded by the Revenue
“Unsurprisingly, the biggest chunk of pension freedoms cash has been used for day-to-day living, with over £7 billion spent in this way.
“This is followed by spending on luxury items such as holidays and new cars, which accounts for almost £4 billion, while others are sensibly paying down debts (£1.4 billion) or using the money to help their kids get on in life (£1.4 billion).
“Perhaps the greatest cause of concern is people stripping a staggering £3.3 billion out of their pensions and shoving the money straight into a bank account. This may be due to a lack of trust in pensions, fears the Government will tinker with the rules in the future or simply because they want to feel in control of the cash.
“These savers face double jeopardy as they risk paying unnecessary tax on withdrawals and seeing the value of their pot eroded by inflation – particularly where their bank account pays 0% interest.
“They also miss out on the opportunity to grow their pot over the longer term by investing in the stock market.”
*The research was conducted by Censuswide between 08.02.2019 - 14.02.2019, with 554 respondents (aged 55+) that have entered pension income drawdown since April 2015. Censuswide abide by and employ members of the Market Research Society which is based on the ESOMAR principles. The full findings from the questions referred to above are detailed below.
|
Average pension fund value |
Average annual withdrawal using income drawdown |
Average % withdrawal per annum using income drawdown |
|
£158,657 |
£7,526 |
4.7% |
What level of investment return do you expect to achieve per year for your personal pension pots?
|
% investment return |
% of respondents |
|
1% |
13.7% |
|
2% |
12.3% |
|
3% |
20.4% |
|
4% |
12.1% |
|
5% |
22.6% |
|
6% |
6.7% |
|
7% |
2.3% |
|
8% |
4% |
|
9% |
0.7% |
|
10% |
4.7% |
|
More than 10% |
0.5% |
|
4.15% |
Average |
Approximately what proportion of your overall annual income do these withdrawals make up?
|
% of overall income |
% of respondents |
|
Up to 4% |
13.5% |
|
5-10% |
25.6% |
|
11-15% |
4.3% |
|
16-20% |
9.6% |
|
21-25% |
6.5% |
|
26-30% |
5.1% |
|
31-35% |
2.2% |
|
36-40% |
3.2% |
|
41%+ |
30.0% |
Have you seen any significant falls in your pension fund value since you entered income drawdown?
|
|
% of respondents |
|
Yes |
11.4% |
|
No |
59.9% |
|
Don't know |
28.7% |
As a result of seeing significant falls in your pension fund value since you entered income drawdown, have you reduced the amount you are withdrawing?
|
|
% of respondents |
|
Yes |
49.2% |
|
No |
50.8% |
Thinking of how you have used the withdrawal(s) you have made from your pension pots, can you estimate how much (as a percentage) of the withdrawal(s) you have spent on each activity below?
|
|
Average proportion per respondent |
|
Day-to-day living |
31.27% |
|
To purchase luxury items (i.e. holidays, cars, home improvements etc.) |
16.26% |
|
To save in a bank account |
14.32% |
|
To invest in another product |
7.39% |
|
To pay off debt |
6.37% |
|
To help my children |
6.08% |
|
To pay for entertainment (restaurant, football season ticket, gambling etc.) |
5.86% |
|
To pay for care |
1.74% |
|
Other |
6.19% |