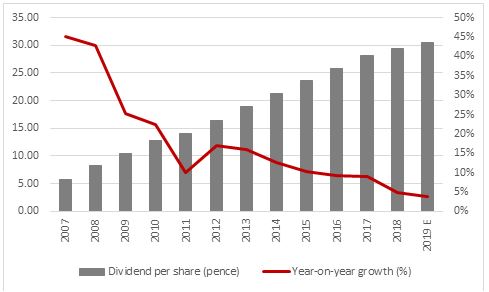
“The absence of any further sales or profit downgrades for this year, 92% revenue visibility to the year end and another dividend increase, adding to a proud record of annual increments that dates back some two decades, are not proving enough to stop the rot in Babcock’s shares, which are now trading at their lowest levels since the first half of 2011” says Russ Mould, AJ Bell Investment Director.

Source: Company accounts, Digital Look, consensus analysts' forecasts for year to March 2019
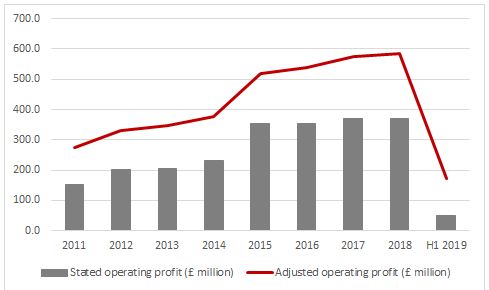
“Sceptics will point to a fudging of the order backlog and order pipeline figures, which are now combined, the ongoing substantial gap between stated and management’s preferred adjusted earnings metric and the admission that sales and profits at the Magnox nuclear decommissioning operation will be lower than previously expected for the fiscal year to March 2020.
Source: Company accounts. Financial year to March.
“The yawning gap between stated and adjusted numbers does not automatically mean that Babcock is sailing close to the wind in terms of its accounting policies, not least because the company’s sales, profit and cash flow growth have historically tracked each other relatively closely, although the year to 2018 did raise some question marks. (This was a test which support services sector peer Carillion consistently failed to pass before its sudden demise).
|
£ million |
2012 |
2013 |
2014 |
2015 |
2016 |
2017 |
2018 |
|
|
|
|
|
|
|
|
|
|
Sales |
3,070.4 |
3,443.5 |
3,547.9 |
4,503.3 |
4,842.1 |
4,547.1 |
4,959.6 |
|
Operating profit |
202.0 |
203.5 |
233.1 |
352.3 |
352.5 |
369.6 |
370.6 |
|
|
|
|
|
|
|
|
|
|
Operating profit |
202.0 |
203.5 |
233.1 |
352.3 |
352.5 |
369.6 |
370.6 |
|
Depreciation |
33.6 |
37.4 |
40.0 |
71.0 |
78.1 |
82.4 |
91.3 |
|
Amortisation |
90.3 |
73.6 |
66.7 |
101.0 |
123.7 |
122.6 |
111.1 |
|
Net working capital |
5.5 |
(15.1) |
(20.0) |
(23.8) |
(12.9) |
(7.7) |
(53.3) |
|
Tax |
(28.0) |
(45.8) |
(55.8) |
(46.1) |
(46.6) |
(61.5) |
(74.3) |
|
Capital expenditure |
(48.7) |
(59.3) |
(53.5) |
(174.1) |
(191.4) |
(206.8) |
(182.7) |
|
Operating Free Cash Flow |
254.7 |
194.3 |
210.5 |
280.3 |
303.4 |
298.6 |
262.7 |
|
|
|
|
|
|
|
|
|
|
Year-on-year change in |
|||||||
|
|
2012 |
2013 |
2014 |
2015 |
2016 |
2017 |
2018 |
|
Sales |
13.6% |
12.2% |
3.0% |
26.9% |
7.5% |
(6.1%) |
9.1% |
|
Operating Profit |
31.9% |
0.7% |
14.5% |
51.1% |
0.1% |
4.9% |
0.3% |
|
Operating Free Cash Flow |
(19.4%) |
(23.7%) |
8.3% |
33.2% |
8.2% |
(1.6%) |
(12.0%) |
Source: Company accounts. Financial year to March.
“But the rash of exceptional charges in the first half, some £120 million before tax in the first half of this year, and the gap between stated earnings and ‘earnings before bad stuff’ would suggest that, at best, Babcock’s management team is having to work harder and harder to maintain sales and profits momentum.
“The shares therefore look cheap on barely 6.5 times earnings for the year to 2019 with a dividend yield of 5.5%, based on consensus analysts’ forecasts – the broader UK market trades on around 13 times earnings with a yield of some 4%.
“But the problem is what will make investors want to take a chance, especially in an environment where the overall support services sector is out of favour and risk appetite seems much reduced compared to three or six months ago? The combination of a dividend which is nearly as high as the price/earnings multiple is low is often the market’s polite way of saying that it does not believe the analysts’ forecasts.
“And it is hard to find a catalyst which will help to change perception of the stock, especially as the Magnox downgrade for fiscal 2020 means profit forecast estimates lack any upward momentum, despite management’s efforts to tidy up its portfolio of operations and boost margins.”

