“The NASDAQ’s phenomenal 3,999-day bull run began on 9 March 2009 and investors will be hoping that a 3.6% surge on 9 March 2022 signalled both the end of a short but painful bear market and the beginning of a new upward surge. However, history suggests that bulls should not start doing any victory laps just yet,” says AJ Bell Investment Director Russ Mould. “Bear markets often see wicked rallies which lure in unwary bulls and trap them with a vicious series of fresh lurches downward. The NASDAQ downturn of 2000-03 saw no fewer than 52 one-day gains of 3.6% or more and the 2007-09 slide saw 19 of them, but that did not stop the index from losing 78% and 56% of its value respectively across those two epic bear markets.
“The 2000-03 post-bubble collapse even saw 57 daily gains of more than 5% and two of more than 10%, while the plunge during the Great Financial Crisis of 2007-09 saw eight daily gains of more than 5% and one of more than 10% simply kid investors that better times lay ahead, only for fresh bear traps to snap shut and inflict further portfolio pain.
|
|
One-day GAINS during NASDAQ bear market |
|||
|
|
TOTAL, 3.6% or more |
3.6% - 4.99% |
5.00% - 9.99% |
10% or more |
|
2000-03 |
52 |
23 |
27 |
2 |
|
2007-09 |
19 |
10 |
8 |
1 |
|
|
|
|
|
|
|
|
One-day LOSSES during NASDAQ bear market |
|||
|
|
TOTAL, 3.6% or more |
3.6% - 4.99% |
5.00% - 9.99% |
10% or more |
|
2000-03 |
58 |
38 |
20 |
0 |
|
2007-09 |
23 |
13 |
10 |
0 |
Source: Refinitiv data
“Investors will be hoping to avoid a repeat of either of those experiences. The fall from November to March took the NASDAQ into bear market territory, as defined by 20% decline from the peak, for two days and bulls will be taking the view that pullback is more akin to the short, sharp bear markets of 1978, 1980, 1987, 1998 and 2020 rather than the soul-crushing slumps of 1973-74, 2000-02 and 2007-09 which saw the index lose 60%, 78% and 56% of its value respectively.
“There have been 12 bear markets in the NASDAQ since 1971.
“On average they have lasted 352 days and shaved 40% off the index’s value. This time around it took 110 days for the index to lose a fifth of its value and the Wednesday rally means it is now down by ‘just’ 17.4% from its closing high on 19 November 2021.
|
NASDAQ Composite bear markets |
|||||
|
Start |
Finish |
Duration (days) |
Start |
Finish |
Decline |
|
11-Jan-73 |
07-Oct-74 |
634 |
137 |
55 |
(59.9%) |
|
13-Oct-78 |
31-Oct-78 |
18 |
139 |
111 |
(20.1%) |
|
13-Feb-80 |
27-Mar-80 |
43 |
165 |
124 |
(24.8%) |
|
29-May-81 |
13-Aug-82 |
441 |
223 |
159 |
(28.7%) |
|
24-Jun-83 |
25-Jul-84 |
397 |
329 |
225 |
(31.6%) |
|
27-Aug-87 |
04-Dec-87 |
99 |
455 |
293 |
(35.6%) |
|
09-Oct-89 |
12-Oct-90 |
368 |
486 |
328 |
(32.5%) |
|
20-Jul-98 |
08-Oct-98 |
80 |
2,014 |
1,419 |
(29.5%) |
|
10-Mar-00 |
11-Oct-02 |
945 |
5,049 |
1,114 |
(77.9%) |
|
31-Oct-07 |
09-Mar-09 |
495 |
2,859 |
1,269 |
(55.6%) |
|
19-Feb-20 |
23-Mar-20 |
33 |
9,817 |
6,861 |
(30.1%) |
|
19-Nov-21 |
09-Mar-22* |
110* |
16,057* |
12,796* |
(20.3%)* |
|
|
|
|
|
|
|
|
Average |
|
352 |
|
|
(39.6%) |
Source: Refinitiv data. *To date.
“Sceptics will look back to those prior bear markets and how rallies lured buyers to their doom. They may therefore be tempted to assert that there could be further losses to come, especially as the worst downturns have come after the most rampant advances and the index’s addition of 9,196 points in just 606 days in its last bull run does look like a classic blow-off top.
“Many other typical signs of bull market excess have been visible for some time – an active initial public offering market (including the craze for SPACS); plenty of merger and acquisition action; huge stock buybacks, in contrast to plentiful selling by management teams; increased use of margin; and lofty valuations, for those companies that actually had any earnings or cashflow to value; and a late move toward the perceived safety of just a handful of stocks, whose business models may indeed by sound but whose rich valuations render their share prices as dangerous as any other (if not more so).
|
NASDAQ Composite bull markets |
|||||
|
Start |
Finish |
Duration (days) |
Start |
Finish |
Decline |
|
05-Feb-71 |
11-Jan-73 |
706 |
100 |
137 |
37.0% |
|
07-Oct-74 |
13-Oct-78 |
1,467 |
55 |
139 |
152.7% |
|
31-Oct-78 |
13-Feb-80 |
470 |
111 |
165 |
48.6% |
|
27-Mar-80 |
29-May-81 |
428 |
124 |
223 |
79.8% |
|
13-Aug-82 |
24-Jun-83 |
315 |
159 |
329 |
106.9% |
|
25-Jul-84 |
27-Aug-87 |
1,128 |
225 |
455 |
102.2% |
|
04-Dec-87 |
09-Oct-89 |
675 |
293 |
486 |
65.9% |
|
12-Oct-90 |
20-Jul-98 |
2,838 |
328 |
2,014 |
514.0% |
|
08-Oct-98 |
10-Mar-00 |
519 |
1,419 |
5,049 |
255.8% |
|
11-Oct-02 |
31-Oct-07 |
1,846 |
1,114 |
2,859 |
156.6% |
|
09-Mar-09 |
19-Feb-20 |
3,999 |
1,269 |
9,817 |
673.6% |
|
23-Mar-20 |
19-Nov-21 |
606 |
6,861 |
16,057 |
134.0% |
|
|
|
|
|
|
|
|
Average |
|
1,250 |
|
|
193.9% |
Source: Refinitiv data
“Moreover, the inflationary damage caused by the 1973 oil price shock led to the 1973-74 bear market in the NASDAQ and that could have uncomfortable echoes for today. Rising energy prices are stoking inflation and may force the US Federal Reserve to take interest rates higher and faster than expected.
“Rising rates and a halt to adding more Quantitative Easing (QE) may drain away some of the liquidity that has done so much to buoy share prices and equity valuations. Rising rates also increases the discount rate used in discounted cash flow (DCF) valuation models. And the higher the discount rate that is applied to long-term growth stocks’ forecast future cash flows, the lower the net present value (NPV) of those estimated cash flows and thus the lower the theoretical valuation of the equity. That means a lower share price.
“Inflation could prompt a dash to other types of company, namely jam-today cyclical stocks which could start to offer nominal rates of growth that mean there is no need to pay a premium valuation for perceived, jam-tomorrow long-term growth stocks. It could also persuade investors to lessen exposure to equities in favour of commodities and ‘real stuff,’ which by and large outperformed ‘paper’ assets in the 1970s.
“Bulls will counter all of this by arguing that the current upset in the NASDAQ is the result of the war in Ukraine and the sanctions on Russia. They will therefore point to the short bear market of 1998 when Russia defaulted on its domestic debt, a crisis that was ended by the Fed’s move to bail out the LTCM hedge funds and provide support to markets. They will also flag the relatively modest downturns of 1978 and 1980 as the Paul Volcker-led Federal Reserve jacked up US interest rates to bring down inflation, in the view that this time’s retreat could be similarly brief.
“There also remains the possibility that soaring oil, gas and metal prices hit consumer spending and corporate investment sufficiently hard that the economy slows right down or even tips into recession. In that case, interest rates may not go up as much as is currently feared and investors may again place a huge premium on earnings growth, given that there may not be much of it to be had in 2022-23 if a slowdown or recession do beckon.
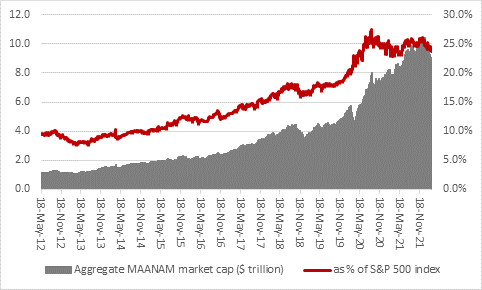
“Six stocks which could yet have a decisive influence are the much-trumpeted FAANGM companies. They have offered little support during the slide, as their combined market cap has also slumped by 17%, or some $2 trillion, from its peak in late December.
“FAANGM is now a bit of a misnomer anyway, since it should be MAANAM now, since the sextet is Meta Platforms, Amazon, Apple, Netflix, Alphabet and Microsoft (after Facebook changed its name to Meta and Google’s parent renamed itself Alphabet.
“The MAANAM sextet is likely to have a big say in the struggle between stock market bulls and bears, not least because their combined stock market valuation of $8.7 trillion still represents almost a quarter of the value of another headline US index, the S&P 500. If Meta, Amazon, Apple, Netflix, Alphabet and Microsoft keep sliding it could be tough for the benchmark indices to make sustained progress.
“The sextet’s combined valuation peaked at $10.5 trillion, equivalent to 26% of the S&P 500 on their own.”
Source: Refinitiv data
“Apple may be the key name going forward, as it has the highest market cap and has so far ceded the least ground.
|
Change in |
Since aggregate peak valuation on 27 December 2021 |
||||||
|
Market cap |
Meta |
Apple |
Amazon |
Netflix |
Alphabet |
Microsoft |
TOTAL |
|
$ billion |
445.6 |
372.2 |
346.8 |
118.8 |
263.1 |
494.1 |
2,040.6 |
|
% |
-44% |
-10% |
-18% |
-41% |
-10% |
-16% |
-17% |
Source: Refinitiv data
