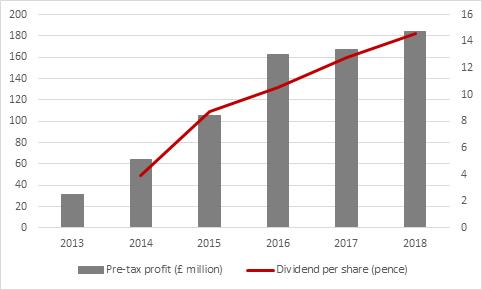
“One Savings Bank’s full-year results show pre-tax profits and a dividend that are both ahead of analysts’ expectations and the strong results reflect how well the bank is doing when it comes to three measures that are particularly important when it comes to judging a bank’s performance: net interest margins, costs and bad loans,” comments Russ Mould, AJ Bell Investment Director.
Source: Company accounts
• Net interest margins. At its core, banking is a simple business. The bank raises funds at a certain cost and then lends those funds out at a higher interest rate, pocketing the difference as a profit. This is, in effect, net interest income. The banks can also generate earnings through fees (as they do via say wealth management, private banking or insurance) or commissions and trading (via investment banking) but at their core it is lending that matters. If you cannot get this right, then you should not be in the business.
Analysts – and the banks themselves – have been expecting net interest margins to rise as interest rate rise. But interest rates have hardly gone up at all and net interest margins have either contracted or increased more slowly than hoped. This is because the banks have faced higher funding costs on one side (as they offer higher deposit rates to attract customers, lose the cheap Term Funding Scheme cash from the Bank of England that expired last year and encounter greater wholesale costs as lenders fight shy of the UK pre-Brexit) and pricing pressure on the other, as lenders compete to offer mortgages and loans.
One Savings Bank’s net interest margin of 3.06% compares well to the returns generated by its peers (and especially the FTSE 100’s Big Five) although it did drop from 3.16% in 2018. The planned merger with Charter Court may be partly designed to combat this trend, as the combined entity will have greater scale and thus may be attract funding more cheaply as a result, to the benefit of its net interest margin.
|
Net interest margin, 2018 |
||||
|
FTSE 100 Big Five |
|
Challenger Banks |
||
|
Barclays |
3.23% |
|
Secure Trust Bank |
7.60% |
|
Lloyds |
2.93% |
|
Charter Court |
3.08% |
|
Royal Bank of Scotland |
1.98% |
|
OneSavings Bank |
3.04% |
|
HSBC |
1.66% |
|
Paragon Banking |
2.21% |
|
Standard Chartered |
1.58% |
|
Metro Bank |
1.81% |
|
|
|
|
CYBG |
1.72% |
Source: Company accounts (last published set)
• Costs. Since 2013, the big five have spent £24.3 billion in restructuring costs, designed to slim down cost bases and drive efficiencies. There has been some progress here, but perhaps not as much as hoped, not least because costs such as the UK bank levy and litigation and conduct charges have refused to go away. In addition, the banks are having to invest heavily to improve their online and digital offerings, as well as boosting their cybersecurity, in the face of competition from challenger banks and fintech start-ups.
The challengers should have an advantage here, especially if there are online only, and one measure that investors can follow here is the cost-to-income ratio. This takes total operating expenses and divides them by net operating income, although some banks can adjust these numbers for loan impairment and other risk-related provisions. Substantial changes in business structure and different business mixes (such as investment banking, where the cost of talent retention can be high) also make direct comparisons difficult, but most of the Big Five banks have shown some progress here – even if perhaps not has much as they had hoped.
Intriguingly, One Savings Bank and Charter Court come out on top here, to suggest they are already very lean, even if management believes cost synergies will be released by the planned merger.
|
Cost-to-income ratio, 2018 |
||||
|
FTSE 100 Big Five |
|
Challenger Banks |
||
|
Lloyds |
49.3% |
|
OneSavings Bank |
28.0% |
|
HSBC |
60.5% |
|
Charter Court |
28.7% |
|
Barclays |
62.0% |
|
Paragon Banking |
40.6% |
|
Royal Bank of Scotland |
71.7% |
|
Secure Trust Bank |
56.7% |
|
Standard Chartered |
78.8% |
|
CYBG |
63.0% |
|
|
|
|
Metro Bank |
86.0% |
Source: Company accounts (last published set)
• Bad loans. Across the Big Five, total annual loan and credit impairments came to just £4.8 billion, way lower than investors have been accustomed to in recent years. HSBC was the one possible blot here, as it showed no improvement in 2018 and sceptics could argue that the only way is up from here, especially if the UK economy and its housing market starts to turn lower. Such fears may explain why shares in the challenger banks did so badly in 2018 and became so cheap. There is no sign of any sudden jump in bad loan impairments as yet but bulls of the sector will be looking very closely at the loan impairment ratio in 2019, in the hope that the banks continue to lend sensibly, manage risk and thus keep impairments at these welcome low levels.
If they can, then profits could rise, especially if net interest margins increase to boost income and costs are kept under control.
|
Loan impairment ratio, 2018 |
||||
|
FTSE 100 Big Five |
|
Challenger Banks |
||
|
Royal Bank of Scotland |
0.13% |
|
Charter Court |
0.03% |
|
HSBC |
0.19% |
|
Paragon Banking |
0.06% |
|
Lloyds |
0.21% |
|
One Savings Bank |
0.10% |
|
Standard Chartered |
0.28% |
|
Metro Bank |
0.15% |
|
Barclays |
0.44% |
|
CYBG |
0.22% |
|
|
|
|
Secure Trust Bank |
0.91% |
Source: Company accounts (last published set)
“If the lender can limit loan losses, then profits could rise, especially if net interest margins increase to boost income and costs are kept under control, and that could in turn help their soggy share prices.
“The Big Five in particular look cheap relative to the book value of their assets (which may just be investors’ polite way of questioning whether that book value is too optimistic) whereas the challengers, which generally offer fewer legacy operational and reputational problems and higher returns on equity, tend to come on lower valuation relative to their profits, to perhaps reflect the prevailing scepticism about the UK economy (and the possible knock-on effects of Brexit).”
|
|
2019E |
2018 |
2019E |
2019E |
|
|
P/E |
Price/book |
Dividend yield |
Dividend cover |
|
|
|
|
|
|
|
FTSE 100 Big Five |
||||
|
HBSC |
10.5 x |
1.12 x |
6.5% |
1.47 x |
|
Lloyds |
8.3 x |
1.17 x |
5.6% |
2.15 x |
|
Royal Bank of Scotland |
9.5 x |
0.91 x |
4.6% |
2.28 x |
|
Standard Chartered |
11.9 x |
0.67 x |
2.6% |
3.26 x |
|
Barclays |
7.5 x |
0.63 x |
4.6% |
2.94 x |
|
|
|
|
|
|
|
Challenger Banks |
||||
|
Secure Trust Bank |
6.8 x |
3.41 x |
7.1% |
2.07 x |
|
Charter Court |
6.8 x |
1.74 x |
4.3% |
3.41 x |
|
OneSavings Bank |
6.9 x |
1.59 x |
4.0% |
3.60 x |
|
Paragon Banking |
8.6 x |
1.58 x |
4.8% |
2.41 x |
|
CYBG |
8.1 x |
0.77 x |
3.6% |
3.42 x |
|
Metro Bank |
16.2 x |
0.66 x |
0.0% |
0.00 x |
Source: Sharecast and consensus analysts’ forecasts for earnings and dividends, Company accounts for historic book value, Refinitiv data
