AJ Bell press comment – 30 July 2019
“Even if analysts had begun to pencil in some sort of dividend cut for 2019, Centrica’s announcement of a near 60% reduction is still a nasty surprise to many, as the share price plunge shows,” says Russ Mould, AJ Bell Investment Director. “That tumble shows there are few worse investments than a yield stock that cuts its dividend, as the insult of a capital loss often adds to the injury caused by the loss of income.
“This shows the importance of doing your own research before taking the plunge on any stock, let alone an income one, but for those who are seeking yield in this low-interest-rate world, there are five tests that must be carried out before a stock is bought and capital put at risk.
“They are
· Earnings cover
· Free cash flow cover
· A healthy balance sheet and good interest cover
· A limited pension deficit or ideally a surplus
· Common sense.
“Centrica failed four of those tests in its 2018 full-year accounts and 2019 interim accounts. This explains why the share price had continued to slide, despite the huge yield that was apparently on offer, as if to say the market did not believe management’s assertion that the 12p-a-share distribution was unsustainable. The market cannot always be right, but its views must be respected on this occasion investors were absolutely on the money. As a result, Centrica is cutting its dividend, the shares are down again and the chief executive is leaving.
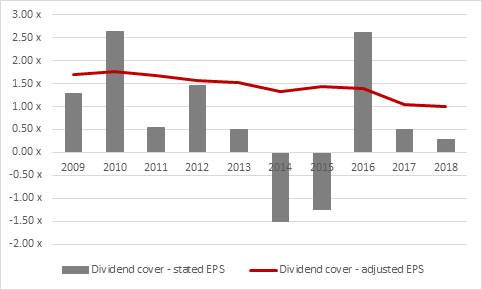
· Earnings cover - FAILED. Earnings cover should ideally above 2.0 or more, especially for cyclical firms, but greater care is now apparently needed with regulated ones too, as Governments take an ever-more active approach (although it will be interesting to see if this changes under a Johnson administration).
On a stated earnings per share basis, Centrica only provided earnings cover of 2.0 time or more on two occasions (2010 and 2016). And while management may have preferred to steer shareholders towards adjusted earnings per share (which could be seen cynically as “earnings before bad stuff”), even here cover did not reach 2.0 once during the 2009-2018, post-crisis period. Worse still, the trend is earnings cover on an adjusted basis was a relentlessly downward one.
Management’s decision to cut the 2019 dividend to 5p is designed to take earnings cover back to 2.0 times.
Source: Company accounts
· Free cash flow cover – FAILED. Like earnings cover, free cash flow cover should ideally come in above 2.0 or more to ensure that management has some wiggle room, in case anything unexpected goes wrong. Remember that bills such as tax, interest and pension contributions will have to be paid come what may and firms must continue to make capital investments to maintain and buttress their competitive position – failure to invest here may help near-term cash flows but only serve to weaken long-term ones.
Source: Company accounts
Centrica fared slightly better here than with dividend cover, as free cash flow cover exceeded 2.0 on four occasions after 2009. However, 2018’s 0.83 times ratio was a big red flag and made it clear that marked improvement in operating performance was required if the dividend was to prove sustainable.
|
£ million |
2009 |
2010 |
2011 |
2012 |
2013 |
2014 |
2015 |
2016 |
2017 |
|
Operating profit |
1,175 |
3,074 |
1,414 |
2,625 |
1,892 |
(1,137) |
(857) |
2,486 |
481 |
|
Depreciation & amortisation |
917 |
1,149 |
1,195 |
1,276 |
2,319 |
3,288 |
3,482 |
1,068 |
1,794 |
|
Net working capital |
899 |
435 |
164 |
63 |
319 |
(677) |
303 |
451 |
236 |
|
Tax |
(503) |
(540) |
(692) |
(524) |
(892) |
(707) |
(349) |
(206) |
(102) |
|
Cash cost of transformation expenses |
(203) |
(223) |
(194) |
(266) |
(224) |
(125) |
(81) |
(276) |
(176) |
|
Net interest expense |
(197) |
(279) |
(179) |
(205) |
(219) |
(261) |
(273) |
(113) |
(296) |
|
Pension contribution |
(329) |
(312) |
(304) |
(9) |
(87) |
(83) |
(131) |
(179) |
(104) |
|
Capital expenditure |
(1,198) |
(1,208) |
(1,064) |
(2,367) |
(1,615) |
(1,456) |
(970) |
(829) |
(882) |
|
Operating free cash flow |
561 |
2,096 |
340 |
593 |
1,493 |
(1,158) |
1,124 |
2,402 |
951 |
|
|
|
|
|
|
|
|
|
|
|
|
Dividends |
635 |
668 |
762 |
815 |
862 |
864 |
387 |
532 |
463 |
|
OpFcF minus Dividends |
(74) |
1,428 |
(422) |
(222) |
631 |
(2,022) |
737 |
1,870 |
488 |
|
|
|
|
|
|
|
|
|
|
|
|
Free cash flow cover |
0.88 x |
3.14 x |
0.45 x |
0.73 x |
1.73 x |
-1.34 x |
2.90 x |
4.52 x |
2.05 x |
Source: Company accounts
· A healthy balance sheet with relatively limited debt and operating profit that covers any net interest payments by at least 2.0 times – FAILED. Centrica ended it first half with £3.4 billion of net debt compared to £2.8 billion of equity, so the gearing ratio was higher than ideal at 119%.
At least in 2018 stated operating profit of £987 million covered net interest expense of £439 million by just over 2.0 times, but it was getting close to the 2.0 mark. ‘Adjusted’ operating profit of £1.4 billion offered more comfort but in the end relying on that did neither management nor shareholders any good.
· A limited pension deficit or ideally a surplus – PASSED. Centrica’s net pension deficit was just £310 million in June 2019, which looks manageable although total scheme obligations come to £9.3 billion. That gap could open again if stock markets topple over and possibly if bond yields and interest rate remain anchored near zero for a lot lower than expected. Centrica has been topping up its pension scheme contributions as interest rates and bond yield have remained lowly and it may have to keep doing so, further pressuring cash flow.
· A common sense a look at the yield – FAILED. If it looks too good to be true in a low-interest-rate, low-growth, low bond-yield world there is a big danger that it is. An unchanged dividend of 12p a share implied a yield of more than 13%, at a time when the headline Bank of England interest rate is 0.75% and the 10-year Government bond yield (the so-called ‘risk free rate’) is just 0.66%. That bordered on the ridiculous, especially as JH Clapham in his Cambridge Economic History of Britain, with reference to the 1840s railway industry boom-and-bust cycle that cleaned out so many investors, had long since warned of the “dangers of blind capital seeking its 5%.”
