The Hong Kong and Shanghai Banking Corporation, as it used to be known, generated (adjusted) pre-tax profits of $8.1 billion in Asia in the first six months of the year, up from $7.2 billion a year ago – that represented two-thirds of both group earnings and the year-on-year improvement in profit.
Adjusted pre-tax profit | ||
$ million | H1 2017 | H1 2016 |
Asia | 8,106 | 7,157 |
of which Hong Kong | 4,833 | 4,207 |
UK | 1,079 | 1,211 |
USA | 926 | 683 |
Middle East and North Africa | 820 | 863 |
Europe | 722 | 436 |
Latin America | 314 | 301 |
Source: Company accounts
Russ Mould, investment director at AJ Bell, comments:
“Such a powerful performance will reassure shareholders that China’s economy is not about to drop into a debt-laden downturn and drag HSBC with it, especially as total charges for bad loans fell in the first half to $663 million from $2.4 billion a year ago.
“Such fears had weighed heavily on the stock at the start of 2016 but they seem to be easing, judging by the results, the share price and also the performance of the Hang Seng index in Hong Kong, where HSBC is also quoted, besides London.
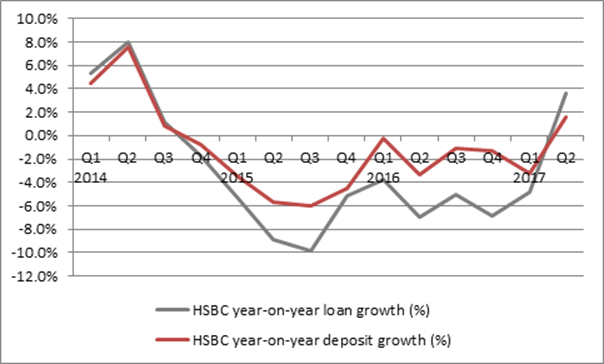
“The strong Asian operating environment can also be seen in how HSBC recorded its best loan and deposit growth for three years in the second quarter of 2017:
Source: Company accounts
“The absence of any fresh conduct and litigation charges is also a welcome bonus (even if the risk-warnings section of the report features a lengthy list of potential legal risks) and HSBC actually wrote back some provisions it had taken previously.
“The additional $2 billion share buyback also hints at management’s confidence in the future, as chairman Douglas Flint prepares to step down, with chief executive Stuart Gulliver potentially following him next year.
“That adds to the $3.5 billion spent over the last 12 months and the unchanged $0.20 in dividend payments across the first six months and while it does look odd that HSBC is buying back shares when they are trading at multi-year highs the stock is at least trading at just one times book (or net asset) value, to suggest that management is not overpaying.”
| Share price | Price/book value | Dividend yield | Dividend cover |
| (pence) |
| 2017 E |
|
|
|
|
|
|
Barclays | 203.4 | 0.72 x | 1.5% | 5.71 x |
Stan. Chart | 840.0 | 0.80 x | 1.6% | 3.00 x |
RBS | 246.7 | 0.83 x | 0.0% | - |
HSBC | 764.6 | 1.01 x | 5.3% | 1.28 x |
Lloyds | 66.1 | 1.26 x | 5.7% | 1.77 x |
Source: Company accounts, last stated NAV figure (interim for Barclays, Lloyds and HSBC, full-year 2016 for RBS and Standard Chartered). Digital Look and analysts’ consensus forecasts for dividend data.