So far in 2017 (41 trading days to the end of February) the FTSE 100 has moved by more than 1% in a trading day from open to close just once.
That compares to a post-1995 average of one such move every five trading days, so normally we would have seen seven or eight such movements by now.
The only other year to start so quietly since 1995 was 2005. It also saw just one move of 1% or more and the FTSE 100 ended the year with a 16.7% capital gain.
Other years to feature five or fewer daily gains or losses of 1% were 1995, 1996, 2004, 2006 and 2014. In only one such instance – 2014 – has the FTSE 100 ended the year with a loss.
Year | FTSE 100 moves | Change in FTSE 100 | |
| >1% in Jan-Feb | Jan-Feb | Whole year |
1995 | 4 | -1.8% | 24.3% |
1996 | 3 | 1.0% | 11.6% |
2004 | 3 | 0.3% | 7.5% |
2005 | 1 | 3.2% | 16.7% |
2006 | 5 | 3.1% | 10.7% |
2014 | 5 | 0.9% | -2.7% |
2017 | 1 | 1.0% |
|
Source: Thomson Reuters Datastream.
Russ Mould, investment director at AJ Bell, comments:
“There is no guarantee that history will repeat itself but the figures could be seen as providing support for the old saying that ‘markets climb a wall of worry but slide down a slope of hope’.
“After all, markets have plenty of potentially tricky issues to ponder, including whether President Trump can deliver on his planned tax-cutting, infrastructure-spending and deregulating plan; Europe’s forthcoming elections and their implications for the euro; and the UK’s ongoing debate over Article 50 and what it will mean for our economy.
“The second half of that saying – which is much less well-known – does remind investors to guard against complacency. It is when expectations – and hopes – are at their highest that disappointment tends to follow and those setbacks initially lead to higher volatility and finally a broad market retreat.
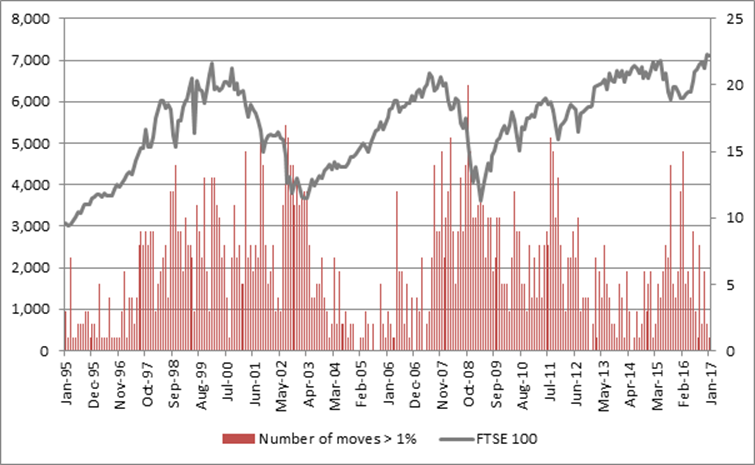
“This is clearly shown by a study of daily movements in the FTSE 100 of more than 1% or more from open to close. The best years for the market come when the number of such daily rises or falls is very limited – 1995-1997, 2004-2006 and 2012-2013 for example.
“You then tend to see further gains although these are much more hard won as markets begin to take several steps back before they rise, as higher expectations (in the form of higher valuations) leave them prey to potential disappointment. The 1998-1999 period, along with 2007, were both instances when spikes in volatility acted as a warning that all was not necessarily well.
Source: Thomson Reuters Datastream
“Then comes panic as hopes for further earnings and dividend growth are conclusively dashed. Volatility rockets as bears maul bulls and markets plunge, as evidenced by the steep FTSE 100 falls of 2000 to 2003 and 2008 to 2009.
“Yet it is when volatility peaks and fear is at its height that investors should look to step in and take advantage of the panic selling. Psychologically this is so hard to do but as legendary investor Sir John Templeton remarked: ’Bull markets are born on pessimism, grow on scepticism, mature on optimism and die on euphoria.’
“The snoozy start to 2017 does not smack of euphoria, so it is possible that we have yet to see the ‘beginning of the end’ for the bull market that began in 2009, as we have yet to see the sort of volatility which traditionally acts as a red flag.
“That said, investors should not be complacent and should look to build a well-balanced, long-term portfolio which prepares them for, and protects their money from, a range of potential market and economic scenarios and not just the one they think will come to pass.”