The FTSE 100 is forecast to yield 4.1% in 2017 and 4.4% in 2018
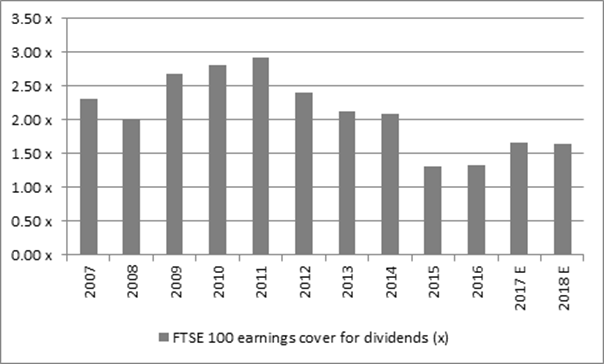
But profit forecasts are being cut and hence dividend cover remains thin at 1.66x
Dividend cover for the ten highest yielding stocks is just 1.2x
Just 10 stocks are forecast to pay 59% of FTSE 100 dividends for 2017
26 FTSE 100 firms have increased their dividend every year for past decade
Dividend cover remains thin
The latest AJ Bell Dividend Dashboard shows that although the FTSE 100 is expected to yield 4.1% for 2017, analysts have started to trim their profit forecasts meaning dividend cover is less than ideal at 1.66 times for the index as a whole. The average cover across the 10 highest yielding stocks in the FTSE 100 is just 1.2 times for 2017.
Russ Mould, investment director at AJ Bell comments:
“The good news is that analysts are still increasing their aggregate dividend forecasts for the FTSE 100 for both this year and next. Consensus is now looking for a 16% increase in 2017 and an 8% increase in 2018, to £85.3 billion and £91.6 billion respectively.
“The interim reporting season backed up this optimism. The 50-plus FTSE 100 members to report earnings forecasts over the summer increased their dividend payments by 15% between them. The resulting forecast yield of over 4% is way better than anything that can be earned on cash or the benchmark 10-year Government Gilt yield of 1.33% and therefore a potential source of support for UK stocks.
“The bad news is that analysts have started to cut rather than increase their aggregate profit forecasts for the FTSE 100, trimming 3% off their forecast for 2017 to £191 billion and leaving 2018 forecasts unchanged at £213 billion.
“The effect of profit estimates going down and shareholder payout estimates going up is that earnings cover for dividends remains much thinner than ideal at barely 1.7 times for 2017 and 2018. Earnings cover needs to be around the 2.0 times mark to offer a margin of safety to dividend payments, should there be a sudden and unexpected downturn in trading at a specific company, or indeed the UK and global economies as a whole.
Source: Company accounts, Digital Look, analysts’ consensus forecasts
“Pearson and Provident Financial are both examples of what can happen in the event of a profits stumble under such circumstances, as both had been offering apparently juicy yields but with skinny earnings cover. Indeed, some of the companies with the juiciest looking dividend yields have dividend cover that looks particularly skinny. Although that figure is dragged down by Shell and BP, only one company (Lloyds) has dividend cover anywhere near the 2.0 times comfort level.”
| Yield, 2017 E | Earnings cover, 2017E |
Direct Line | 7.1% | 1.21x |
Taylor Wimpey | 6.9% | 1.41x |
Next | 6.9% | 1.18x |
Royal Dutch Shell | 6.6% | 0.90x |
BP | 6.6% | 0.71x |
SSE | 6.6% | 1.25x |
Unilever | 6.4% | 1.55x |
Lloyds | 6.2% | 1.87x |
Centrica | 6.2% | 1.30x |
Vodafone | 6.0% | 0.58x |
Average |
| 1.20 x |
Source: Company accounts, Digital Look, analysts’ consensus forecasts
Dividend concentration is high
“Income-seekers, and especially those investors who are looking to draw dividends from the UK market by buying a passive tracker fund or ETF, also need to consider that just 10 stocks represent 58% of forecast FTSE 100 dividend payments for 2017.
| Forecast percentage contribution to FTSE 100 cash dividend payments in 2017E |
Royal Dutch Shell | 14% |
HSBC | 9% |
BP | 7% |
British American Tobacco | 5% |
GlaxoSmithKline | 5% |
Unilever | 4% |
Rio Tinto | 4% |
Vodafone | 4% |
Lloyds | 3% |
AstraZeneca | 3% |
Source: Company accounts, Digital Look, analysts’ consensus forecasts
“A further increase in the oil price, beyond $55 a barrel, would therefore be a welcome development as it would help to boost the oil major’s profits and cashflow. Sustained strength in metals prices would also be helpful, as the miners are generating nearly half of the forecast dividend increase in sterling terms for 2017, while banks and insurers are also key contributors.
“Between them, financials, oils and miners are forecast to produce 51% of dividend payments and 71% of dividend growth in 2017.”
Percentage of forecast dividend payments - 2017 |
| Percentage of forecast dividend growth - 2017
| ||
Financials | 21% |
| Mining | 38% |
Oil & Gas | 21% |
| Financials | 25% |
Consumer Staples | 15% |
| Consumer Staples | 19% |
Mining | 9% |
| Oil & Gas | 8% |
Health Care | 9% |
| Industrial goods & services | 5% |
Consumer Discretionary | 7% |
| Telecoms | 3% |
Industrial goods & services | 6% |
| Health Care | 3% |
Telecoms | 6% |
| Technology | 2% |
Utilities | 4% |
| Real estate | 1% |
Real estate | 1% |
| Utilities | 0% |
Technology | 1% |
| Consumer Discretionary | -1% |
Source: Company accounts, Digital Look, analysts’ consensus forecasts
Dividend heroes
26 FTSE 100 companies have grown their dividend every year for at least the past 10 years, with investment trust Scottish Mortgage topping the list with 34 consecutive years of dividend growth.
Russ Mould, continues:
“This makes a strong case for the investment trust model, as they are allowed to store up to 15% of their annual income on their balance sheet and use these so-called reserves to pay and boost dividends when markets are falling or going nowhere fast.
“Of the other firms with the longest streaks, it is noticeable that none of them necessarily do anything that it seen as exciting or provide go-go growth. SSE is a utility, BAT is a tobacco giant, Sage provides accounting and payroll software and Bunzl distributes essential items to other companies, ranging from mops to syringes to coffee cups.
“Yet all of them have a strong competitive position, a debt pile which is suitable for their type of business and good profit margins, which mean they can throw out plenty of cash flow – and good cash flow can mean good and growing dividends.
“In all cases, this consistent dividend growth has had a positive impact on the total returns offered by the stock over the past decade compared to the FTSE 100 average:
Company | Consecutive number of years of dividend increases | Total return over the past 10 years |
Scottish Mortgage | 34 | 296% |
Johnson Matthey | 31 | 131% |
SSE | 26 | 76% |
Bunzl | 24 | 311% |
Sage | 22 | 285% |
British American Tobacco | 20 | 318% |
Croda | 19 | 651% |
DCC | 19 | 591% |
Diageo | 19 | 216% |
Associated British Foods | 18 | 385% |
Compass | 17 | 578% |
Paddy Power Betfair | 17 | 427% |
Babcock International | 15 | 117% |
Imperial Brands | 15 | 159% |
Intertek | 15 | 492% |
BAE Systems | 14 | 102% |
InterContinental Hotels | 14 | 400% |
Vodafone | 14 | 116% |
Whitbread | 14 | 188% |
Ashtead | 13 | 1842% |
Prudential | 13 | 246% |
Shire | 13 | 235% |
Micro Focus | 12 | 1050% |
St James’ Place | 12 | 286% |
Hargreaves Lansdown | 10 | 796% |
Standard Life Aberdeen | 10 | 153% |
Average |
| 402% |
FTSE 100 |
| 64% |
Source: Thomson Reuters Datastream