Forecast dividend cover for the FTSE 100 in 2018 is 1.63 – lower than it was at the height of the financial crisis a decade ago
However, forecast dividend growth of 7% underpins a projected 4.3% yield from the index next year
Dividend cover for the ten highest yielding stocks is just 1.37
Dividend concentration is high - just 10 stocks are forecast to pay 55% of FTSE 100 dividends for 2018
Dividend danger zone – the ten companies with the lowest dividend cover in the FTSE 100
Plump forecast pay-out may support UK stocks in 2018
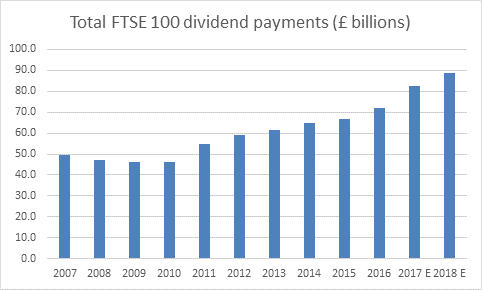
The latest AJ Bell Dividend Dashboard shows that the FTSE 100 is forecast to pay out a total of £88.5 billion in dividends in 2018, which is a 7% increase on the final forecast pay out for 2017.
This equates to a yield of 4.3%, way better than anything that can be earned on cash or the benchmark 10-year Government Gilt yield of 1.2% and therefore a potential source of support for UK stocks next year.
Dividend cover is still a source of concern
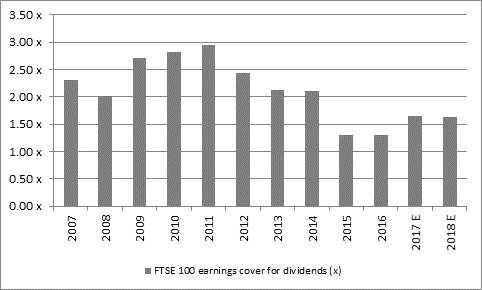
Whilst total dividend payments have been steadily improving since the lows of the aftermath of the financial crisis in 2010, dividend cover is not looking so healthy.
Earnings cover for dividends paid by the FTSE 100 as a whole remains much thinner than ideal at 1.63 times for 2018 and significantly below the ideal 2.0 level and the level seen in the midst of the financial crisis ten years ago.
Source: Company accounts, Digital Look, analysts’ consensus forecasts
Russ Mould, investment director at AJ Bell comments:
“The issue of skinny dividend cover refuses to go away. Earnings cover for dividends remains much thinner than ideal at 1.63 for 2018 and there has been little real improvement here in 2017. Ideally earnings cover needs to be around the 2.0 level to offer a margin of safety to dividend payments, should there be a sudden and unexpected downturn in trading at a specific company, or indeed the UK and global economies as a whole.
“Pearson and Provident Financial are both examples of what can happen in the event of a profits stumble under such circumstances, as both had been offering apparently juicy yields but with skinny earnings cover. Indeed, some of the companies with the juiciest looking dividend yields have dividend cover that looks particularly malnourished at 1.37.
“Shell’s slide out of the top-ten yielders list (for the pure and simple reason that its shares have done well) and the prominence of cash-rich house builders has improved this dividend cover figure from the 1.20 level we saw this year – although the presence of Centrica and recent share price action suggests the spectre of dividend cuts still lurks.”
The ten companies that are forecast to have the highest dividend yield next year are:
| Dividend yield 2018 | Dividend cover 2018 |
Centrica | 8.0% | 1.24x |
Direct Line | 7.7% | 1.12x |
Taylor Wimpey | 7.6% | 1.41x |
SSE | 7.2% | 1.26x |
Barratt Developments | 7.1% | 1.49x |
Lloyds | 6.8% | 1.62x |
BT | 6.2% | 1.73x |
GlaxoSmithKline | 6.2% | 1.35x |
Legal and General | 6.2% | 1.52x |
BP | 6.1% | 0.99x |
Average |
| 1.37x |
Dividend concentration is high
Financial stocks, particularly the large Banks and Insurers, will be very important for income seekers in 2018 as they are forecast to drive nearly half of the FTSE 100’s dividend growth next year. Consumer staples (tobacco, beverages, food retailers) and consumer discretionary (Sky in particular), are also forecast to boost shareholder payouts.
Percentage of forecast dividend growth in 2018
| |
Financials | 47% |
Consumer Staples | 16% |
Consumer Discretionary | 15% |
Industrial goods & services | 9% |
Mining | 7% |
Telecoms | 2% |
Utilities | 1% |
Health Care | 1% |
Technology | 1% |
Real estate | 1% |
Oil & Gas | 1% |
Dividend hunters should note that the bulk of the FTSE 100 dividends payments come from a relatively small proportion of the index. Financials (23%), oil & gas explorers (20%) and miners (8%) will provide the largest source of dividend income in 2018, accounting for 51% of the index’s total dividend payments. The top 10 dividend payers on their own are forecast to represent over half (55%) of the total shareholder pay outs in 2018.
| Forecast percentage contribution to FTSE 100 cash dividend payments in 2018 |
Royal Dutch Shell | 14% |
HSBC | 9% |
BP | 7% |
British American Tobacco | 5% |
GlaxoSmithKline | 4% |
Vodafone | 4% |
Lloyds | 4% |
AstraZeneca | 3% |
Rio Tinto | 3% |
Glencore | 2% |
Russ Mould, continues:
“Income-seekers, and especially those investors who are looking to draw dividends from the UK market by buying a passive tracker fund or ETF, need to consider that just 10 stocks represent 55% of forecast FTSE 100 dividend payments for 2017.
“A sustained spell for oil above $60 a barrel would therefore be a welcome development as it would help to boost the oil majors’ profits and cash flow and support their meaty dividends. However, it is the banks and insurers who still dominate the dividend growth forecasts for 2018, closely followed by consumer staples such as beverage and food retailers and consumer discretionary stocks such as Sky.
Dividend danger zone
The ten companies with the lowest dividend cover in the FTSE 100 contains three of the highest dividend yields (Centrica, Direct Line and BP) and all but two of them (Hargreaves Lansdown and St James’s Place) are forecast to yield significantly more than the FTSE 100 as a whole.
| Dividend cover 2018 | Dividend yield 2018 |
Centrica | 1.24x | 8.0% |
Hammerson | 1.22x | 5.0% |
Hargreaves Lansdown | 1.22x | 2.5% |
British Land | 1.19x | 4.8% |
Direct Line | 1.12x | 7.7% |
Royal Dutch Shell | 1.07x | 6.0% |
St. James's Place | 1.05x | 4.0% |
Admiral Group | 1.03x | 5.9% |
HSBC | 1.00x | 5.4% |
BP | 0.99x | 6.1% |
Vodafone | 0.70x | 6.0% |
FTSE 100 average |
| 4.3% |
Appendix:
Dividend cover explained
Dividend cover is the amount of profit a firm makes divided by the dividend it pays out to shareholders.
The table below shows the dividend cover for a company making a profit of £100 and paying three different levels of dividend:
Dividend | Calculation | Dividend cover |
£50 | £100 divided by £50 | 2 |
£100 | £100 divided by £100 | 1 |
£150 | £100 divided by £150 | 0.67 |
What level of dividend cover to look for
Divided cover of below 1.0 should ring alarm bells because it means the company is paying out more to shareholders than it makes in that year. This means it has to dip into cash reserves, sell assets or borrow money to maintain the payment. This is unlikely to be sustainable over the long term.
Dividend cover of around 1.5 is less than ideal because it means a company has less room for manoeuvre if profits fall in one year. It will then need to decide whether to reduce its dividend, stop reinvesting in the business or take on more debt.
Dividend cover of 2.0 or above is ideal because it means profit is double the amount the company is paying out to shareholders. This means it can continue to invest in the business and has scope to maintain its dividend payment in a bad year.
All data correct as at 11 December 2017.