Interest rates, along with wages, inflation and the value of the pound all could have an impact on markets but there are five lesser known indicators that can be used to judge whether markets are rightly bouncy, or becoming dangerously bubbly to the point of bursting.
Russ Mould, investment director at AJ Bell, explains:
“In sum none of these five signals look to be flashing danger – if anything all are flashing green for go, although after what is now almost a nine-year bull run in UK stocks, even that could be a reminder of Warren Buffett’s aphorism that the right time to be fearful is when everyone is greedy and the right time to be greedy is when everyone is fearful, and right now there is little, if any, fear in evidence.
1. The transportation indices. The old theory goes that if the transports are not performing, the industrials can’t either, as if nothing is being shipped, nothing is being sold. It is therefore reassuring to see both the FTSE All-Share Industrial Transportation and America’s Dow Jones Transports indices powering higher, to offer a ‘green’ signal to global stocks.
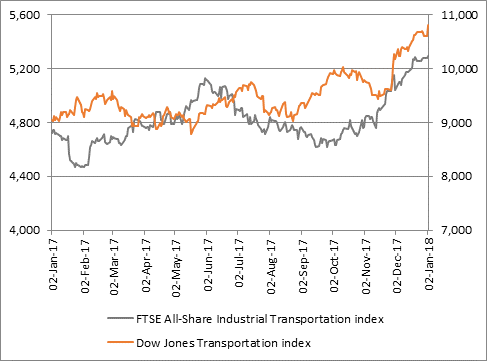
Source: Thomson Reuters Datastream
2. Doctor Copper. The industrial metal is a great barometer for global economic health. Copper hit a six-year low in January 2016 but it has hardly looked back since and a further sustained increase in the metal’s price would help to reaffirm investors’ faith that the dominant inflation/reflation trade is the right one.
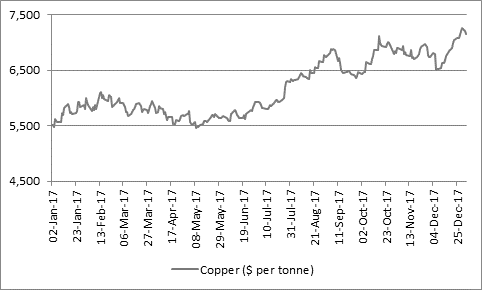
Source: Thomson Reuters Datastream
3. Small caps. Market minnows are an excellent indicator of risk appetite - they tend to outperform when investors are bullish and fall faster than the broader market when they are bearish. The UK’s FTSE Small Cap and America’s Russell 2000 both continue to make solid progress, even if the megacap FTSE 100 and Dow Jones Industrials are grabbing all of the headlines. Bulls will want to see these benchmarks keep ticking higher and their gains so far offer a positive sign.
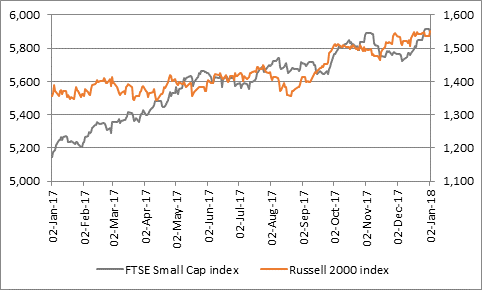
Source: Thomson Reuters Datastream
4. Market volatility. Volatility can be the friend of the investor – it can provide chances to sell stock expensively or buy it cheaply – but history shows that stock indices progress best when they make serene progress and a series of modest gains and tend to fare less well when trading is choppy and there are big swings up and down.
The FTSE 100 moved higher with a minimum of fuss in 2017 when there were just 17 open-to-close movements of more than 1% in the index throughout the whole year.
That was the lowest total since 2005’s reading of 18 and the UK stock market advanced smartly for a further 18 months after that.
Further peaceful gains, in incremental steps, would further encourage this is a bull run and not some frenzied bubble that is primed to burst, assuming historic trends repeat themselves.
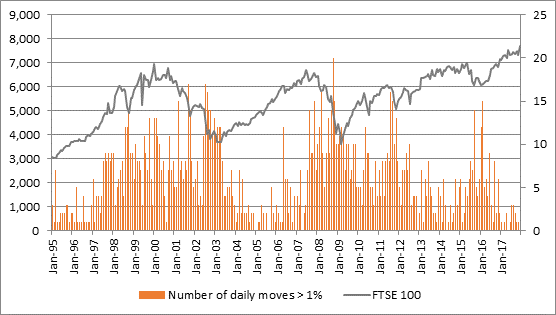
Source: Thomson Reuters Datastream
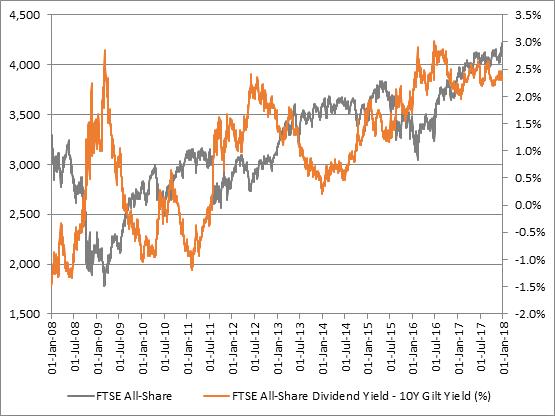
5. Valuation – and especially the dividend yield. In the end, the valuation paid for an asset is the ultimate arbiter of the investment returns made on it. Valuation metrics using forecast earnings can be unreliable, as those forecasts are often wrong, so dividend yield can offer more comfort. Management teams are reluctant to cut the shareholder payouts as this tends to hit a share price hard and potentially their own wallets.
At the time of writing, the FTSE All-Share is yielding 3.60%, compared to a 10-year Gilt yield of 1.31% - that’s a 230 basis point (2.3%) premium.
The All-Share has only twice previously offered a premium yield of 2% or more since 2008 - and on both occasions the stock market promptly made healthy gains.”
Source: Thomson Reuters Datastream