“A 46% jump in lettings to £33.5 million and a drop in the vacancy rate down to 0.6% in the first nine months of 2019 are testimony to both the quality of Derwent London’s portfolio and the enduring appeal of London as a destination for property investors,” says Russ Mould, AJ Bell Investment Director. “Derwent’s three major developments, two in W1 and one in EC1, represent 790,000 square feet of property and are already 70% pre-let.
“All of this gives grounds for optimism that asset values can remain firm and reassure those who fear retail exposure or are more concerned about the health of the UK economy more generally. It also helps to explain why the Real Estate Investment Trusts (REITs) sector has confounded the doubters so far in 2019 with a 17.5% gain, outpacing the 10.4% capital gain from the FTSE All-Share index.
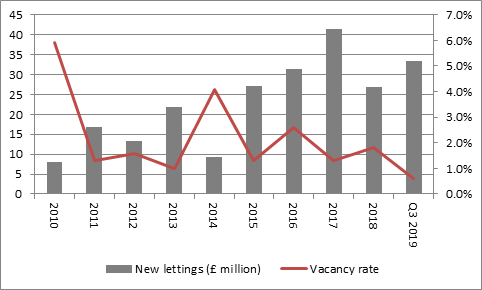
Source: Company accounts
“A further 443,000 square feet across to further projects in W1 already has planning consent and that could set the scene for additional increases in net asset value (NAV) per share.
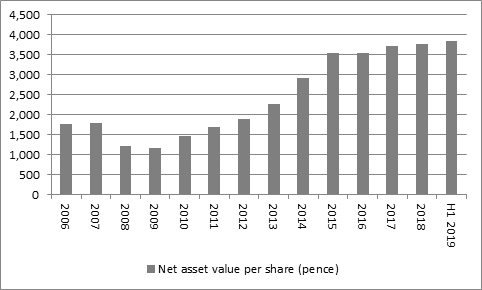
Source: Company accounts
“A healthy balance sheet, where the loan-to-value ratio is just 16.4% (and interest cover exceeded four times at the interim stage), means Derwent has the financial firepower to further develop its portfolio and maintain a 26-year streak of increases in its annual dividend.
“The REIT has a broad spread of assets and clients across the nation’s capital, whose global appeal remains strong, thanks in no small part to the UK’s rule of law, the independence of its central bank and what could well be a cheap currency.
“As of the end of 2018, the West End represented 40% of its assets, the City 33% and Southbank and Docklands 8% apiece, in term of floor space. Media clients generated 29% of the rent roll, professional services 20% and retail 31%, although that was split between retailers’ head offices (19%) and retail and leisure sites (12%).The biggest customers were Expedia, Burberry and the Government.
“If there is one knock on Derwent London it may be the valuation of its shares. A 5.7% discount to the last stated net asset value (NAV) per share figure is pretty skinny and may not leave a huge amount of near-term scope for share price appreciation. Equally, that narrow discount is the result of the firm’s dividend track record, its solid finances and long-term NAV growth potential as the company’s development pipeline starts to bear fruit.”
|
|
Share price (p) |
Historic NAV per share (p) |
Premium / (discount) |
|
Safestore |
698.8 |
406.0 |
72.1% |
|
Big Yellow |
1,145.0 |
724.4 |
58.1% |
|
Londonmetric Property |
233.9 |
172.1 |
35.9% |
|
Helical |
364.0 |
287.8 |
26.5% |
|
SEGRO |
847.2 |
673.0 |
25.9% |
|
Hansteen |
103.9 |
104.3 |
(0.4%) |
|
TRITAX Big Box |
148.8 |
150.1 |
(0.9%) |
|
Workspace |
1,054.5 |
1,086.0 |
(2.9%) |
|
Derwent London |
3,561.0 |
3,776.0 |
(5.7%) |
|
Great Portland Estates |
790.0 |
849.0 |
(6.9%) |
|
Shaftesbury |
924.5 |
995.0 |
(7.1%) |
|
St. Modwen |
446.3 |
492.5 |
(9.4%) |
|
Harworth |
123.5 |
141.3 |
(12.6%) |
|
CLS |
242.0 |
287.8 |
(15.9%) |
|
Capital & Counties |
248.9 |
315.0 |
(21.0%) |
|
RDI |
136.1 |
185.5 |
(26.6%) |
|
Newriver Retail |
196.2 |
283.0 |
(30.7%) |
|
Land Securities |
900.0 |
1,339.0 |
(32.8%) |
|
British Land |
594.6 |
905.0 |
(34.3%) |
|
Town Centre Securities |
207.0 |
354.0 |
(41.5%) |
|
Hammerson |
284.3 |
685.0 |
(58.5%) |
|
INTU |
30.9 |
210.0 |
(85.3%) |
Source: Refinitiv data, company accounts (for last reported net asset value per share figure)
