2018E | ||||
Percentage of forecast FTSE 100 profits |
| Percentage of forecast FTSE 100 profits growth | ||
Financials | 25% |
| Financials | 30% |
Consumer Staples | 14% |
| Oil & Gas | 25% |
Oil & Gas | 14% |
| Health Care | 17% |
Mining | 14% |
| Consumer Staples | 15% |
Consumer Discretionary | 10% |
| Consumer Discretionary | 7% |
Industrial goods & services | 8% |
| Industrial goods & services | 4% |
Health Care | 8% |
| Utilities | 2% |
Telecoms | 3% |
| Technology | 1% |
Utilities | 3% |
| Telecoms | 1% |
Technology | 1% |
| Mining | 0% |
Real estate | 0% |
| Real estate | -2% |
Source: Digital Look, analysts’ consensus pre-tax profit forecasts
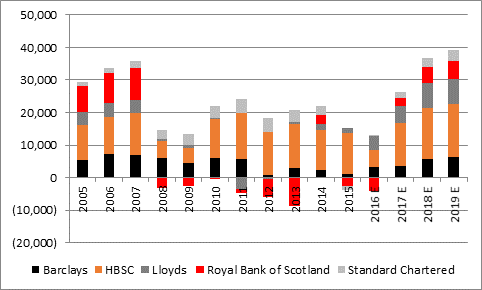
“The catch is that, for the umpteenth year in the row, analysts are expecting Barclays, HSBC, Lloyds, RBS and Standard Chartered to generate between them profits that match the pre-crisis peak of £36 billion – and such forecasts have proved inaccurate for the past several years, with hopes for a return to the glory days of the previous decade repeatedly thwarted.
“Dangers still abound in 2018, notably the prospect of fines from the US authorities for RBS, further PPI costs and also increased investment in digital services, so these optimistic estimates should not necessarily be taken for granted.

Source: Digital Look, analysts’ consensus pre-tax profit forecasts
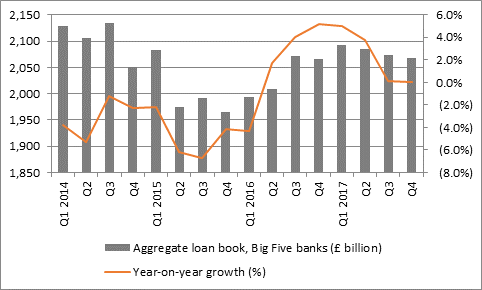
“As the Big Five prepare to release first quarter figures, investors can look at three sets of figures in particular to see if the banks are capable of meeting these lofty expectations.
Loan growth. In sterling terms the Big Five’s aggregate loan book, at just over £2 trillion, is no bigger than it was in late 2014, although disposals and currency movements will have something to do with this. On a stated basis their combined loan books were broadly flat year-on-year in the fourth quarter, even if HSBC and Standard Chartered both reported robust increases, so any growth could be a good sign for the broader economy, not to mention the banks’ earning power as the yield curve steepens and net interest margins rise.

Source: Barclays, HSBC, Lloyds, RBS and Standard Chartered accounts
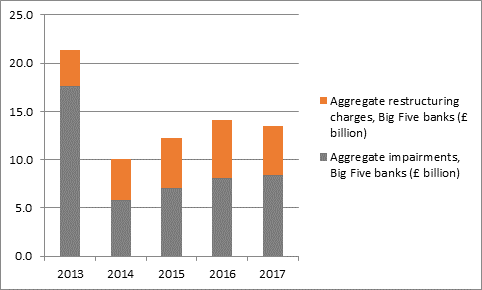
Bad loans, impairments and restructuring costs. The total in bad loan write-offs (also known as impairments) came to £1.9 billion in Q4 2017, down 4% year-on-year. However, loan losses and impairments still rose in 2017 overall, to £8.4 billion, so it would be good to see this come down to help profits and the banks’ overall health. More encouragingly, combined restructuring costs fell by just under £900 million to £5.1 billion and further drops here would again help earnings – although HSBC and Lloyds to name but two have started to talk about increased investment, especially in digital and online services, to suggest that costs may rise elsewhere even if a brutal period of restructuring is coming to an end.

Source: Barclays, HSBC, Lloyds, RBS and Standard Chartered accounts
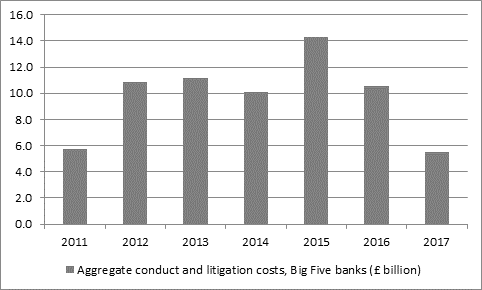
Litigation and conduct fine payments. The total cost here across the Big Five in 2017 was ‘just’ £5.5 billion in 2017, way down from more than £10 billion in 2016. However, Barclays has already been hit by a $2 billion (£1.4 billion) penalty by the US Department of Justice and Royal Bank of Scotland is waiting to see how much it is fined for alleged mis-selling of mortgage backed securities in America in the lead up to the great financial crisis. The Barclays fine was smaller than many had expected although the RBS bill could still reach eleven figures (in dollar terms) by some estimates. The size of these costs may still have a big say in the dividends which the banks can pay. It is to be hoped they are now nearing the end of PPI and looking to keep their noses clean as this is pretty much pure cash outflow –the £68 billion in fines paid since 2011 compare to forecast dividend payments of £65 billion over the same period.

Source: Barclays, HSBC, Lloyds, RBS and Standard Chartered accounts
“If the banks can keep restructuring, impairment and conduct costs down then they may start to look like the potential cash cows they are, but that remains a big ‘if’ – and that all comes before any fresh investment in their competitive position to retain customers or win new ones, in the face of fierce competition and ongoing regulatory pressure.
“But if they can, then the banks could start to look like tempting yield plays, especially Lloyds and HSBC, while the other three have the potential to start rebuilding their payout – Barclays is targeting an increase in its distribution to 6.5p from 3.0p in 2018.
Aggregate impairment, restructuring and conduct costs (£ billion) | ||||||
| 2013 | 2014 | 2015 | 2016 | 2017 | TOTAL |
HSBC | 5.7 | 4.6 | 4.8 | 6.1 | 4.1 | 25.3 |
Standard Chartered | 1.0 | 1.6 | 3.1 | 2.8 | 1.5 | 10.0 |
RBS | 12.9 | 2.3 | 5.8 | 8.5 | 3.3 | 32.8 |
Lloyds | 8.0 | 5.8 | 5.6 | 3.3 | 3.9 | 26.6 |
Barclays | 4.9 | 5.8 | 7.3 | 4.1 | 6.1 | 28.2 |
TOTAL | 32.5 | 20.2 | 26.6 | 24.7 | 19.0 | 123.0 |
|
|
|
|
|
|
|
Big Five aggregate (billion) | ||||||
Pre-tax profit | 11.8 | 21.9 | 11.6 | 8.9 | 26.2 | 80.6 |
Dividends | 8.1 | 9.6 | 9.6 | 9.8 | 11.8 | 48.9 |
Source: Barclays, HSBC, Lloyds, RBS and Standard Chartered accounts
“In addition, shares in Barclays, RBS and Standard Chartered all trade below net asset in the banks’ respective historic tangible net asset value (NAV) per share figures. This suggests they are potentially cheap stocks, if they can keep their noses clean and costs down.
|
| 2018E |
|
|
| P/E | Price/Book | Dividend Yield | Dividend cover |
Barclays | 9.6x | 0.77x | 3.0% | 3.4x |
Stan. Chart. | 12.7x | 0.79x | 3.4% | 2.3x |
RBS | 10.5x | 0.90x | 3.35 | 2.9x |
HSBC | 12.2x | 1.24x | 5.5% | 1.5x |
Lloyds | 9.5x | 1.27x | 6.4% | 1.6x |
Source: Thomson Reuters Datastream; Digital Look, analysts’ consensus forecasts for earnings and dividends; company accounts for historic book value per share figures.
Appendix: reporting dates for the Big Five UK banks
Wednesday 25 April: Lloyds
Thursday 26 April: Barclays
Friday 27 April: RBS
Wednesday 2 May: Standard Chartered
Friday 4 May: HSBC