“A vote of 6 - 3 to leave interest rates unchanged at 0.5% and Quantitative Easing (QE) unchanged at £445 billion suggests that the Bank of England is closer to the European Central Bank rather than the more aggressive US Federal Reserve in its outlook, with any tightening of monetary policy likely to come slowly and in modest steps,” says AJ Bell Investment Director Russ Mould.
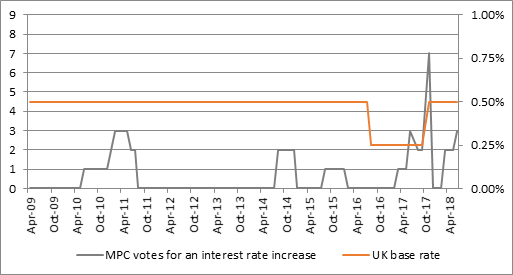
Source: Bank of England
“Today’s inactivity may reflect lingering doubts over the underlying strength of the UK economy, which appears to be mired in another soft patch.
“This heaps more pain on savers as inflation continues to comfortably outstrip the meagre interest earned on their cash and real wage growth remains negligible.
Comparison of when UK base rates last rose twice in an upcycle compared to today:
| February 2004 | Latest figure for 2018 |
Bank of England base rate (%) | 4.00% | 0.50% |
Unemployment rate (%) | 10.1% | 4.2% |
CPI inflation (%) | 1.3% | 2.3% |
Wage growth (%) | 3.5% | 2.5% |
Real wage growth (%) | 2.2% | 0.2% |
House price inflation (%) | 18.3% | 1.9% |
Source: ONS, Bank of England, Halifax
“On the other hand, stock market investors may welcome today’s impasse. There have been 10 interest rate increase cycles since the inception of the FTSE All-Share in 1962 and the index has done better when interest rates have been going down than when they have been going up, from the first to the last move:
|
| Average |
|
| Duration of cycle (days) | Shift in rates | Market response |
Lower | 788 | (4.91%) | 25.1% |
|
|
|
|
Higher | 434 | 4.76% | 11.4% |
Source: Thomson Reuters Datastream, covering period of first rate change to the last
“However, the range of performance during rate-hike cycles is wide, with four drops and six gains and the overall average result is still a net increase. The UK stock market has historically been able to take the strain of higher borrowing costs providing underlying economic growth and corporate profits growth were robust (which is arguable at this time).
“The marked exceptions were 1972-73 and 1976. Inflation was galloping higher in the first case, owing to the lingering after-effects of the Barber boom, while in 1976 inflation surged into the mid-teens and forced James Callaghan’s Labour Government to go cap in hand to the IMF for a $3.9 billion emergency loan.
“It does tend to take time for the market to gather its footing, though, as investors adapt to the new environment and since last November’s quarter-point increase the FTSE All-Share has reacted to the first interest rate increase of a cycle with typical caution.”
Interest rate hike cycle | Change over full interest rate cycle | Change in FTSE All Share after first rate hike | |||||
From | To | From | To | 3 months | 6 Months | 1 Year | 2 years |
18-Oct-67 | 17-Nov-67 | 5.50% | 8.00% | 2.3% | 23.2% | 36.7% | 18.0% |
22-Jun-72 | 13-Nov-73 | 5.00% | 13.00% | (3.6%) | 4.8% | (8.5%) | (44.8%) |
26-Apr-76 | 07-Oct-76 | 9.00% | 15.00% | (7.0%) | (27.5%) | 6.6% | 23.6% |
28-Nov-77 | 15-Nov-79 | 5.00% | 17.00% | (4.8%) | 6.2% | 11.0% | 13.0% |
06-Jul-84 | 28-Jan-85 | 8.88% | 13.88% | 9.0% | 19.4% | 23.8% | 66.4% |
03-Jun-88 | 06-Oct-89 | 7.38% | 14.88% | (3.4%) | (2.3%) | 15.5% | 24.1% |
13-Sep-94 | 11-Feb-95 | 5.13% | 6.63% | (6.4%) | (5.5%) | 12.2% | 24.9% |
30-Oct-96 | 04-Jun-98 | 5.69% | 7.50% | 5.9% | 9.4% | 16.7% | 28.3% |
08-Sep-99 | 10-Feb-00 | 5.00% | 6.00% | 5.2% | 4.5% | 7.7% | (16.6%) |
06-Nov-03 | 05-Jul-07 | 3.50% | 5.75% | 2.5% | 4.8% | 10.0% | 27.0% |
02-Nov-17 | ? | 0.25% | ? | (0.8%) | 0.7% |
|
|
|
|
|
|
|
|
|
|
Average |
|
|
| (0.1%) | 3.4% | 13.2% | 16.4% |
Source: Thomson Reuters Datastream
Bond markets
“However, bond markets are not entirely convinced by the Fed’s tough stance, let alone talk of interest rate hikes from the Bank of England. This can be seen in how the yield curve has flattened in both the US and the UK.
“Near-term interest rates – as per the UK 2-year Gilt yield and the US 2-year Treasury yield – have moved higher, to factor in interest rate hikes and higher headline borrowing costs. However, the yields on 10- and 30-year Government bonds have moved much less, if at all.
“As a result the yield differential between 2-year and 10-year Gilts and Treasuries and 10- and 30-year Gilts and Treasuries has continued to shrink – in theory, longer-dated paper should offer a higher yield as it takes longer for investors to receive their coupons and return of principal upon maturity, so more things can go wrong in the interim and the higher yield is compensation for this.
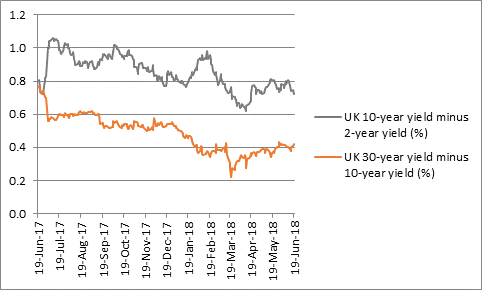
Source: Thomson Reuters Datastream
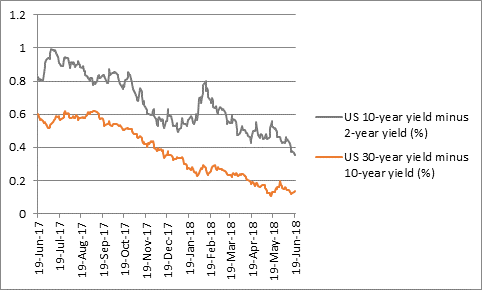
Source: Thomson Reuters Datastream
“In this case, the flattening of the yield curve suggests that bond investors do not share stock market investors’ current enthusiasm for the narrative of a globally synchronised recovery.
“The underlying message from the bond market is that central banks may try to raise rates in the short term but will quickly backtrack at the first sign of any growth disappointment or financial market upset, either cutting rates or expanding QE once more.
“If the central banks do go down that path – and effectively try to sacrifice near-term inflation targets in favour of an all-out dash for growth – then investors will need to be in short-duration bonds and looking for inflation protection from value strategies and cyclical stocks – real estate and oils for example – along with miners, commodities and plays on real ‘stuff’ like property and gold, as well as index-linked bonds.”