“Apple’s shares have surged by 40% from their December lows, to bring the $1 trillion market capitalisation figure back into view, but they are also still some 15% below last autumn’s all-time high and the Californian giant’s second-quarter numbers explain why, because it has yet to truly recapture its profit momentum,” says Russ Mould, AJ Bell Investment Director.
“The second-quarter earnings per share figure of $2.47 beat the consensus forecast (shaped by the company’s downbeat guidance back in January) of $2.37 – but don’t forget that analysts had been looking for $2.73 before the first-quarter numbers.
“Moreover, Apple’s guidance for its fiscal third-quarter suggests earnings per share will reach $2.05, pretty much in line with the current consensus of $2.07. Its pointers for the next quarter imply that sales will rise by around 0.5% in April-June period, with low double—digit percentage declines in operating profit, net income and earnings per share.
|
|
Q2 2018 |
Q3 |
Q4 |
Q1 2019 |
Q2 |
Q3E |
Q4E |
Q1 2020E |
|
EPS ($) |
2.73 |
2.34 |
2.91 |
4.18 |
2.47 |
2.05 |
2.66 |
4.45 |
|
Year-on-year growth |
30% |
40% |
41% |
8% |
(13%) |
(12%) |
(8%) |
7% |
Source: Company accounts, analysts’ consensus estimates, NASDAQ.com
“Some of this is just the usual seasonal swings in the business but earnings are also being shaped by a shift in the business mix and it may be this that investors are seeing as the most positive aspect from the results (as well as the absence of any further profit alert from boss Tim Cook after the downward steer given to forecasts in both December and January).
|
($ million) |
Actual |
Actual |
Actual |
Guidance |
|
|
Q3 2017-18 |
Q1 2018-19 |
Q2 2018-19 |
Q3 2018-19E |
|
Sales |
53,265 |
84,310 |
58,015 |
53,500 |
|
|
|
|
|
|
|
Gross profit |
20,421 |
32,031 |
21,821 |
20,063 |
|
Gross margin |
38.3% |
38.0% |
37.6% |
37.5% |
|
|
|
|
|
|
|
Operating costs |
(7,809) |
(8,685) |
(8,406) |
(8,750) |
|
Operating profit |
12,612 |
23,346 |
13,415 |
11,313 |
|
Operating margin |
23.7% |
27.7% |
23.1% |
21.1% |
|
|
|
|
|
|
|
Financial income |
672 |
560 |
378 |
250 |
|
Tax |
(1,765) |
(3,941) |
(2,232) |
(1,907) |
|
Tax charge |
13.3% |
16.5% |
16.2% |
16.5% |
|
|
|
|
|
|
|
Net income |
11,519 |
19,965 |
11,561 |
9,655 |
|
Earnings per share ($) |
2.34 |
4.18 |
2.47 |
2.05 |
Source: Company accounts, company guidance
“Apple has stopped publishing unit volume figures for the iPhone, iPad and iMac so analysts and shareholders have to content themselves with sales figures instead.
“Total product sales fell 9% year-on-year in the second quarter, hampered by a 17% slide in iPhone revenues – that was an even-greater decline than Q1’s 14.9% drop. A recovery in iPad sales helped, to perhaps suggest that replacement cycles for Apple product are alive and well, if getting longer. But a 16% surge in services sales really carried the day as Apple sold more services and subscriptions into its installed base of 1.4 billion devices. It is this sticky nature of loyal Apple users which now lie at the heart of the investment case for the company, as their willingness to take on and pay for new services will drive Apple’s future profits and cash flows more than their desire to buy the latest gadgets.
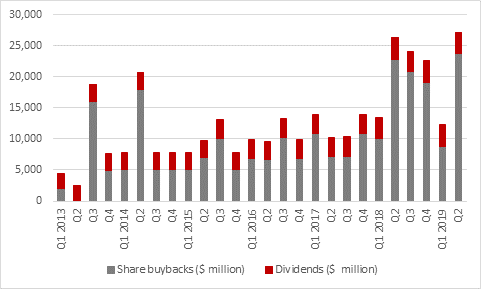
“And cash flow is still very powerful, so much so that Apple could yet again raise its dividend and add $75 billion to its share buyback programme. Since the company began to buy back stock and pay dividends in the calendar fourth quarter of 2012 (its fiscal first quarter for 2012-13) Apple has now bought $254 billion of its own shares and paid out $78 billion in dividends.
“That $332 billion bonanza compares to Apple’s market cap of $490 billion as of Christmas 2012 - with the prospect of more to come, since Apple still has a $113 billion net cash pile.
Source: Company accounts
